The new development of RNAInter.
1. Expand data sources and coverage of species.
2. Support new function of fuzzy and batch search.
3. Provide four interactome tools: RIscoper, IntaRNA, PRIdictor, DeepBind.
4. Add the RNA editing/localization/modification/structure, target region and interaction network.
5. Dynamic expression pattern of RNAs in human(or mouse) spermatogenesis and HSC lineage commitment is added.
The homepage is displayed in the following Fig 1-1.
Fig 1-1:
1. Main functions of the database are provided in menu bar form (boxed in light blue).
2. Other databases contributed by our group.
3. Cite information.
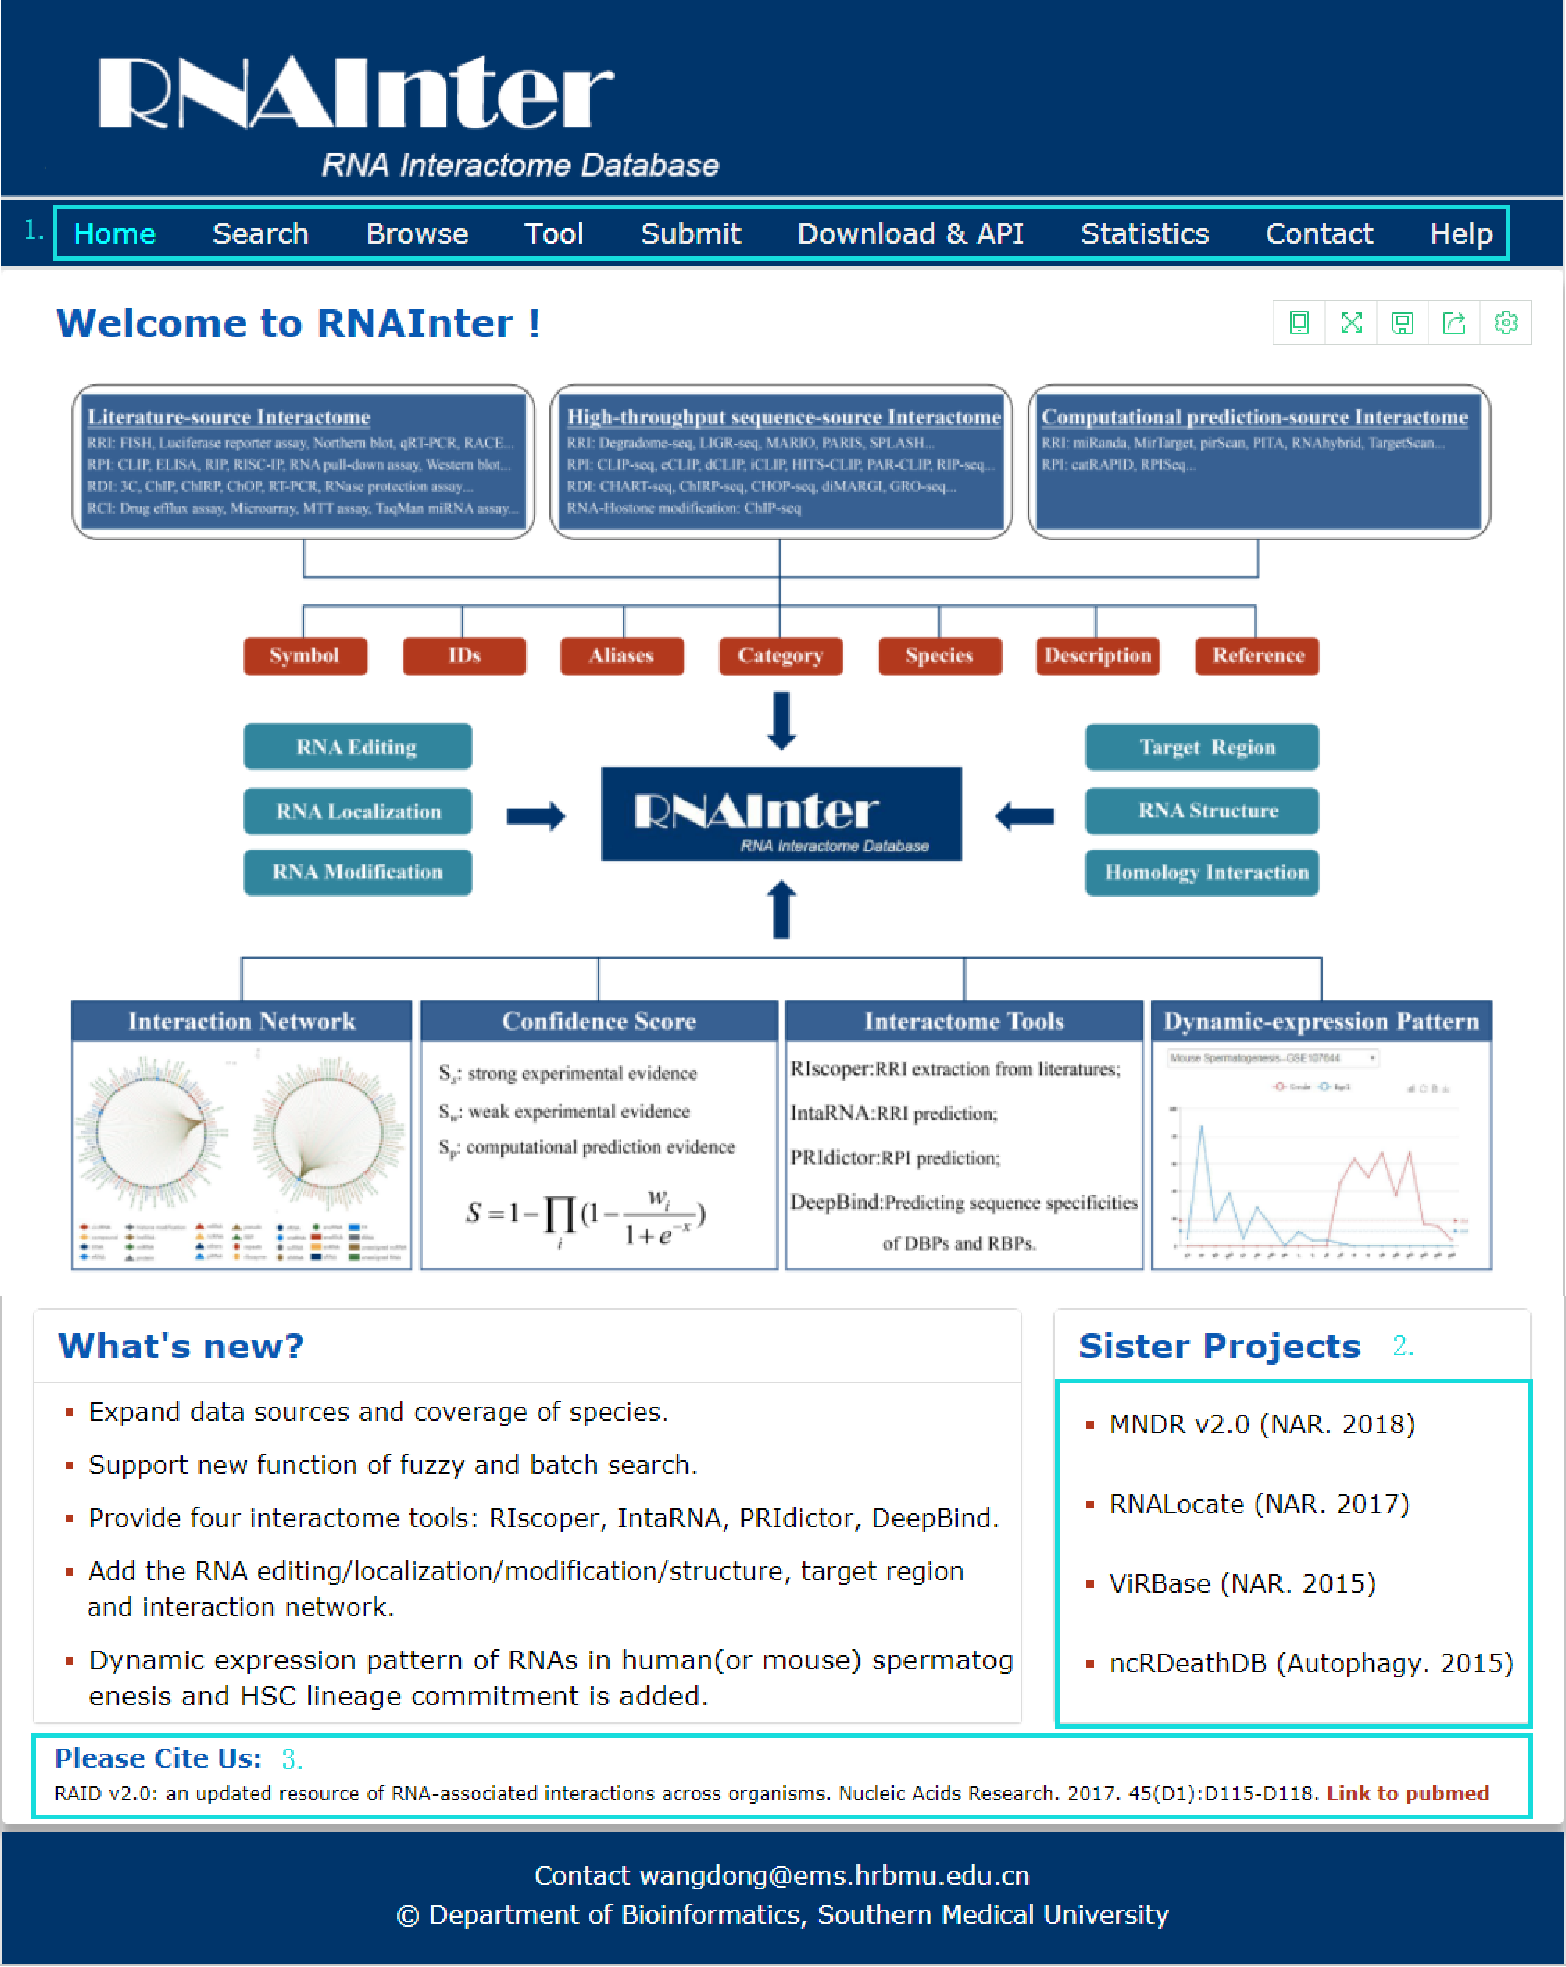
Fig 1-1 Homepage
The Exact search page is displayed in Fig 2-1:
1. Carefully select a dataset: Three choices are provided.
2. Enter a keyword corresponding to selected dataset.
3. Five categories provided to filter results: Category, Interaction Type, Species, Detection Method and Score.
4. Use NCBI Gene/NCBI PubChem Compound/Ensembl/miRBase to normalize your input symbol and ID.
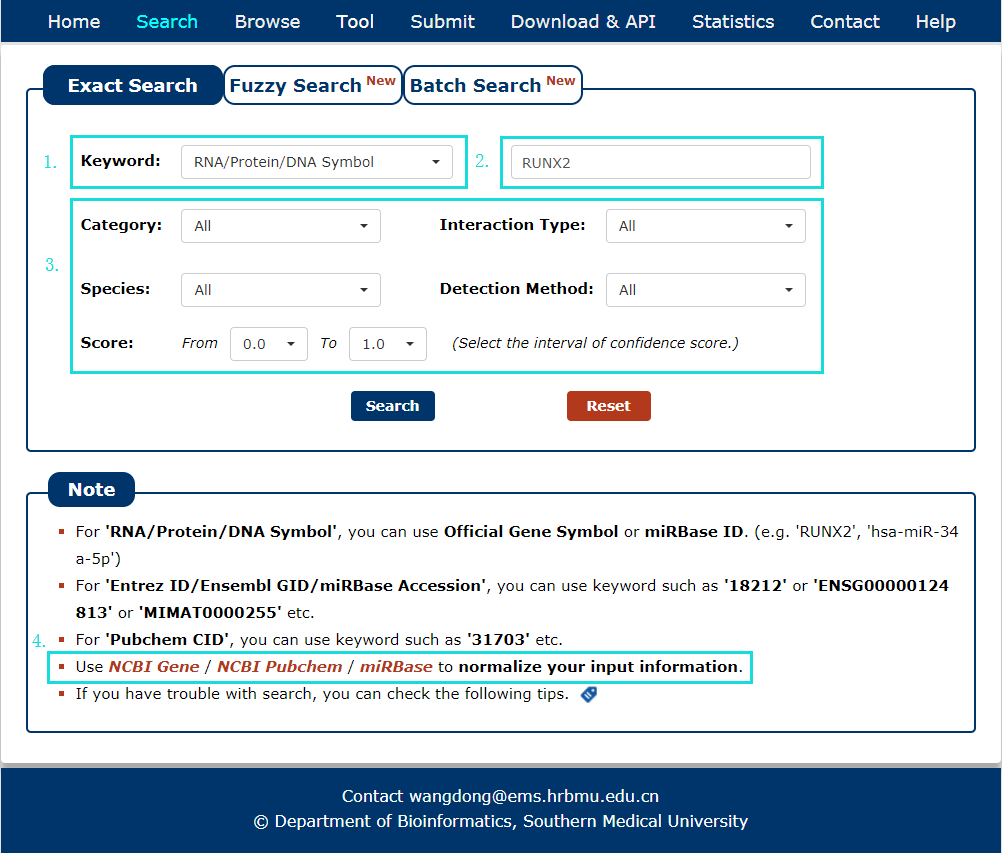
Fig 2-1 Exact Search page
The Fuzzy search page is displayed in Fig 2-2:
1. Select the category of your keyword.
2. Enter a keyword corresponding to selected.
3. Choose the match entries what you want.
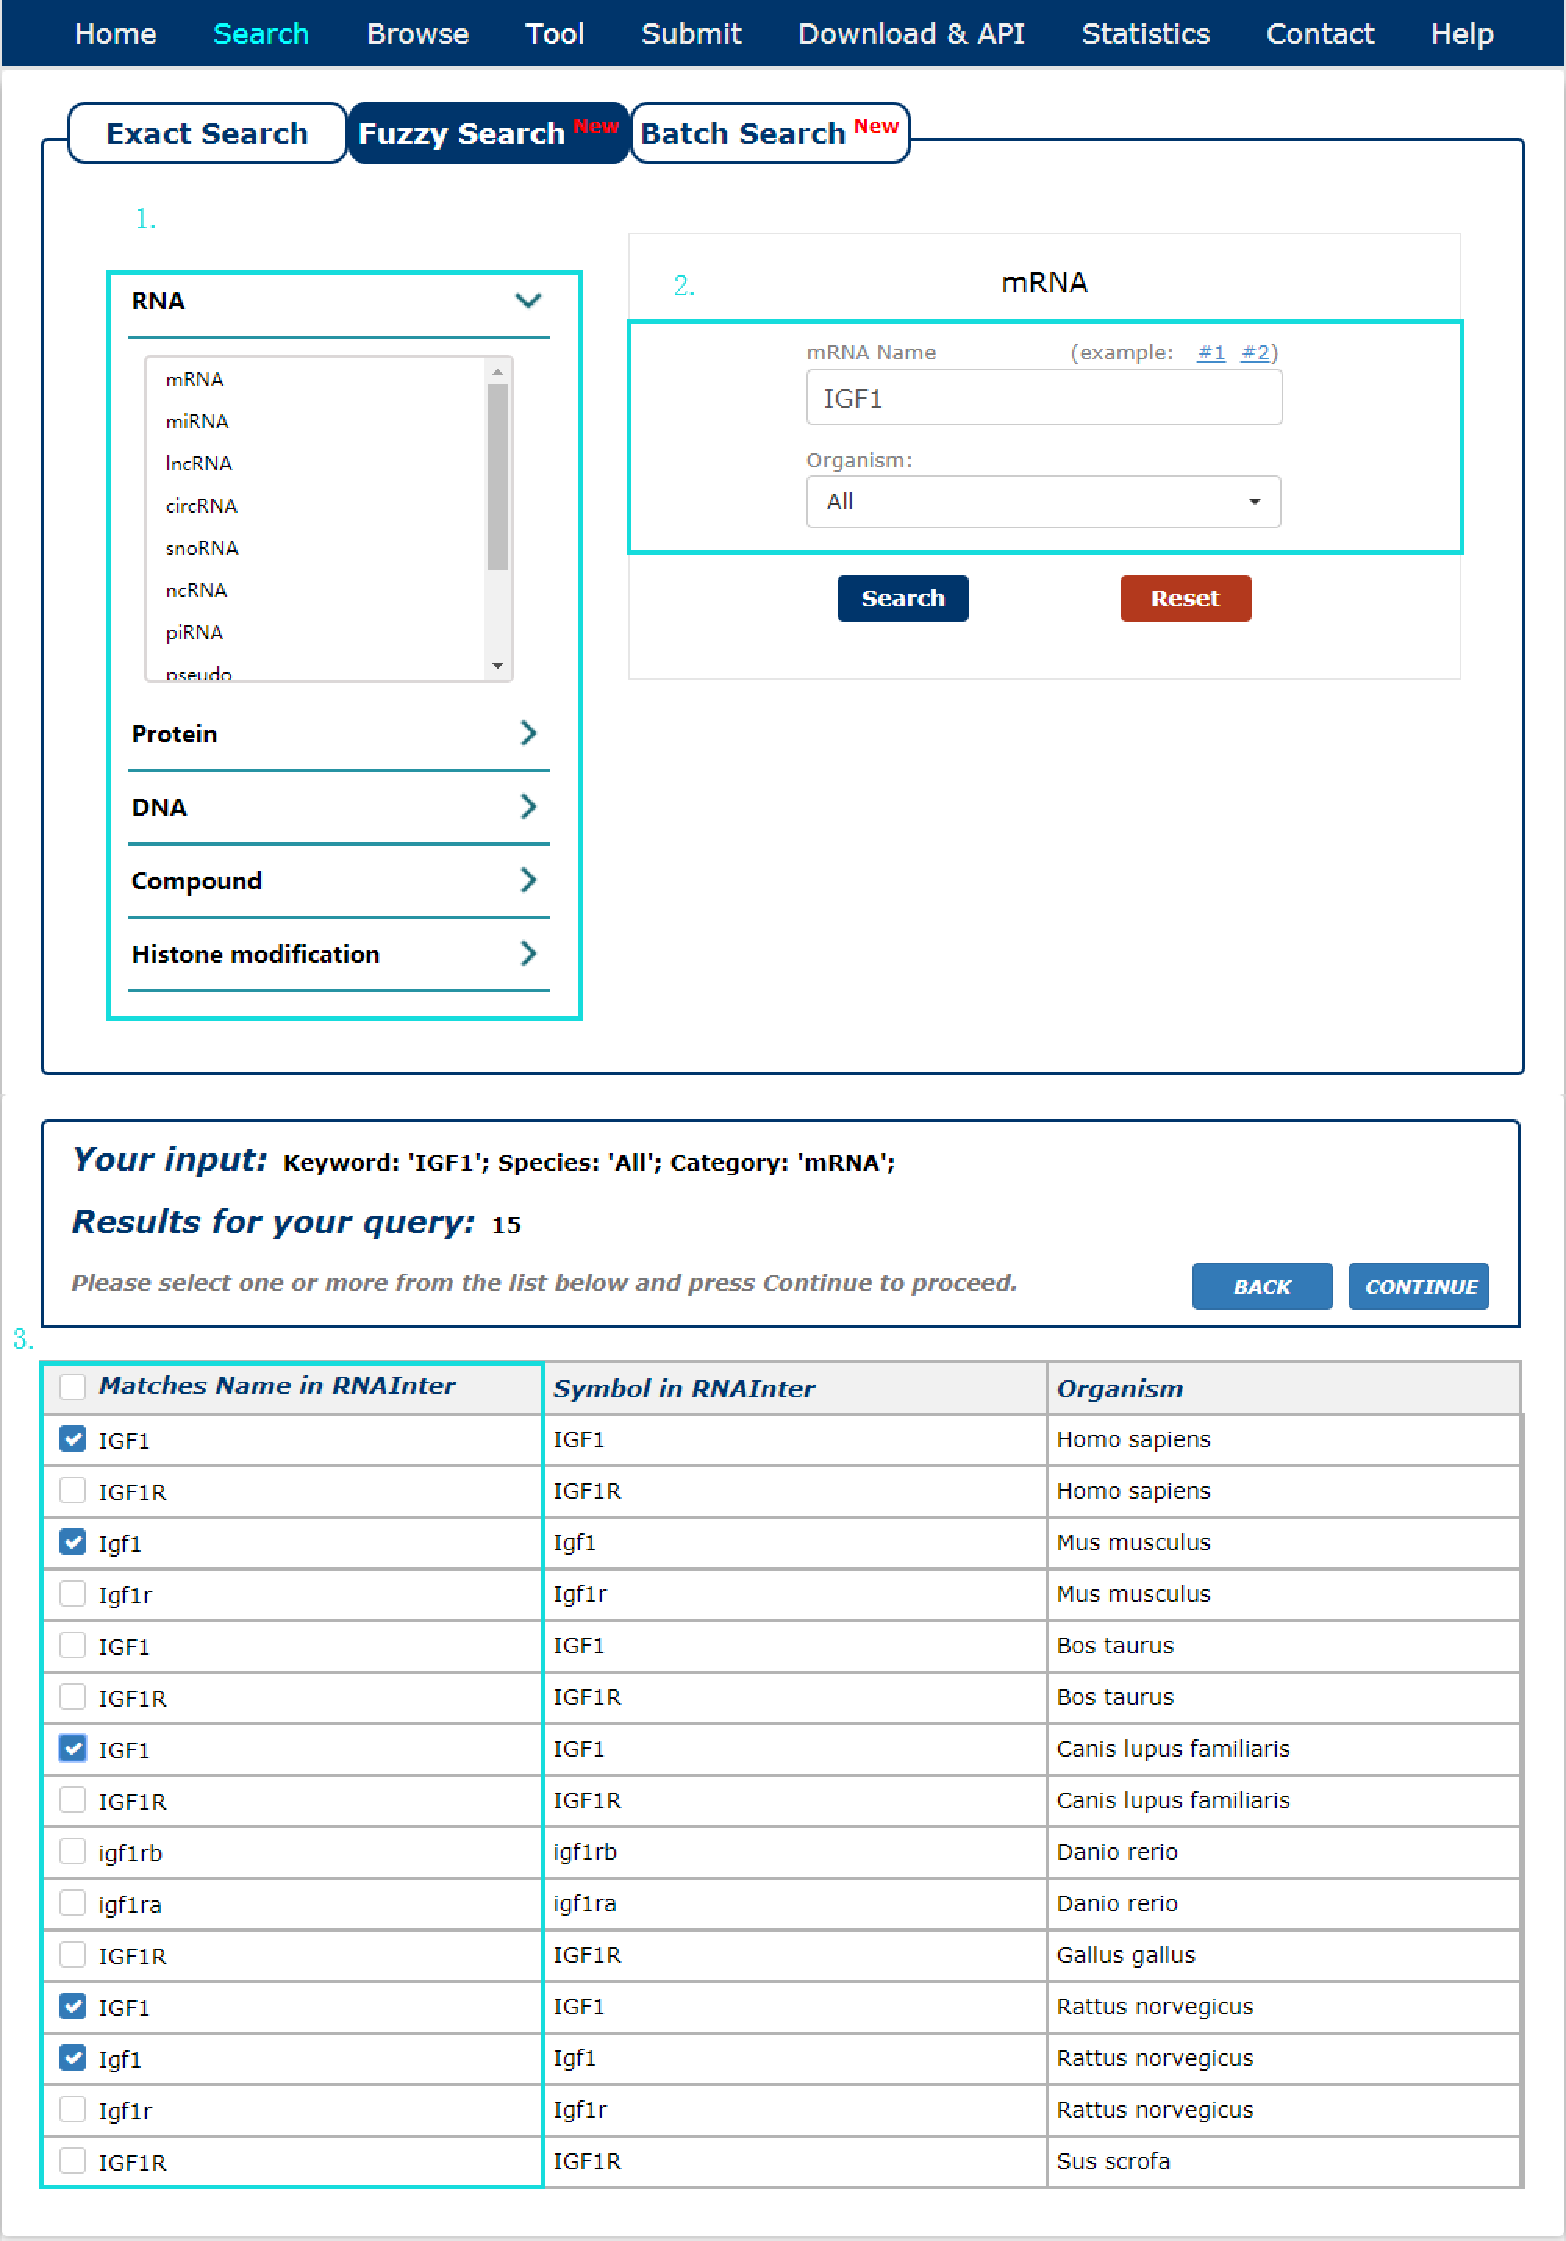
Fig 2-2 Fuzzy Search page
The Batch search page is displayed in Fig 2-3:
1. Select a dataset for your keywords.
2. Enter the keywords or upload a file.
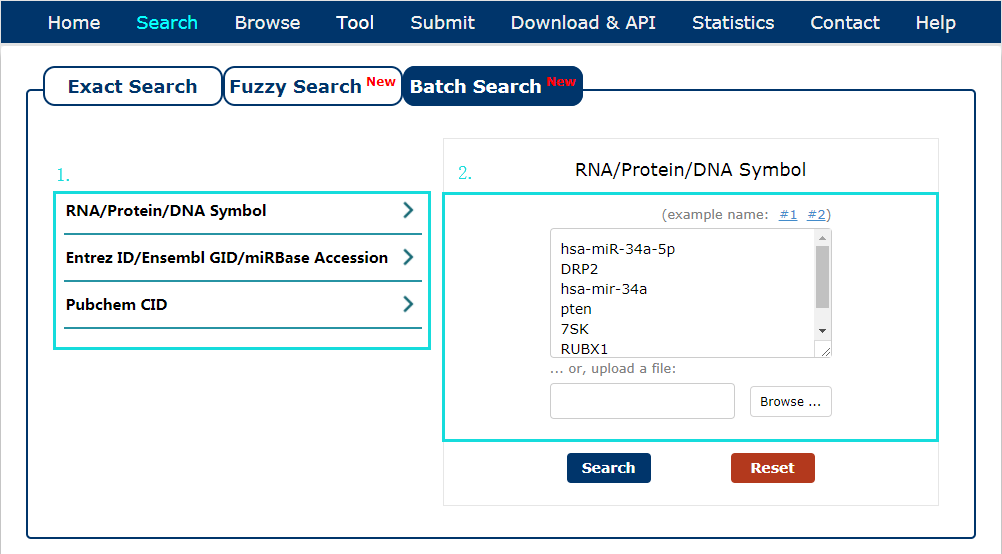
Fig 2-3 Batch Search page
This tutorial is as follows.
1. First we have to choose the type of keyword. There are three keyword types in our search as the picture shows. In this example, we choose RNA/Protein/DNA Symbol as the keyword type.
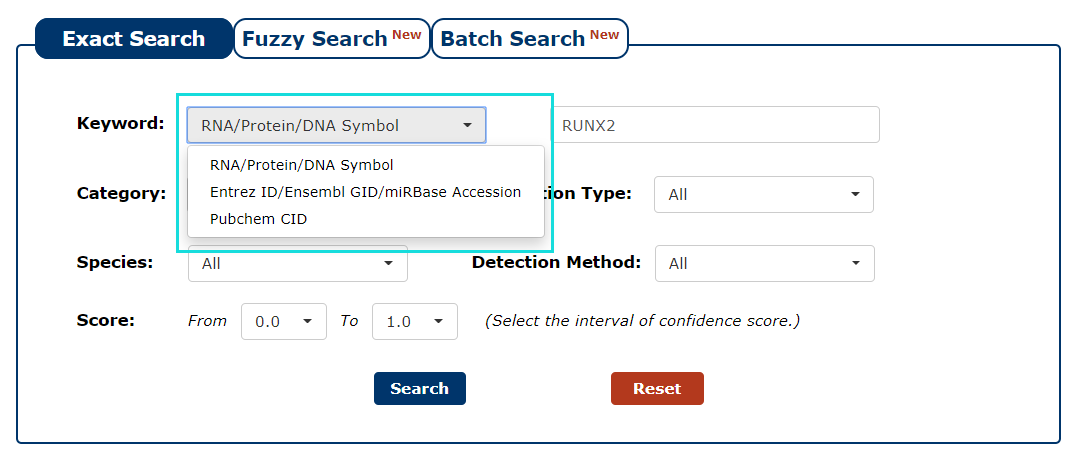
Fig 3-1
2. Next, we enter the keyword according to the keyword type selected in the previous step. In this example, we choose 'MEG3' as the keyword.
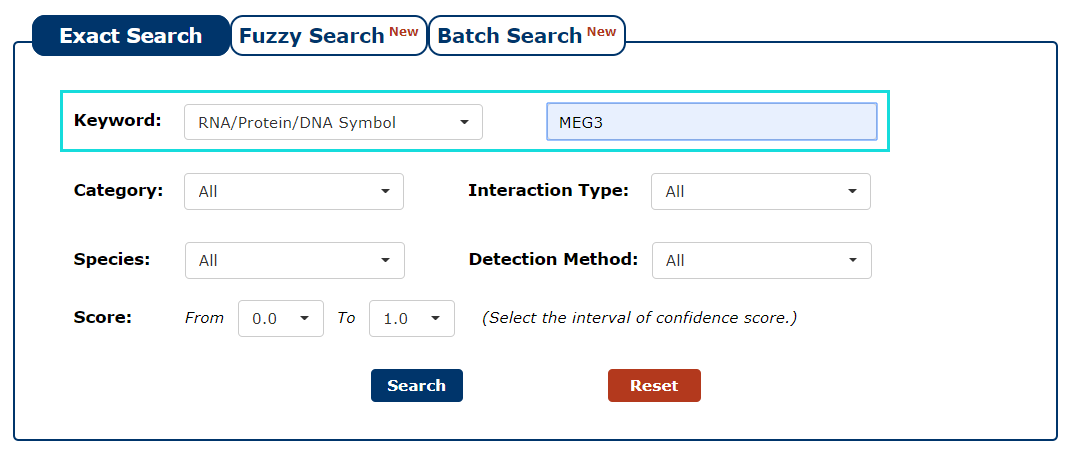
Fig 3-2
3. Then select the category for the keyword you entered. In this example, we choose 'lncRNA' as the category of the keyword 'MEG3'.
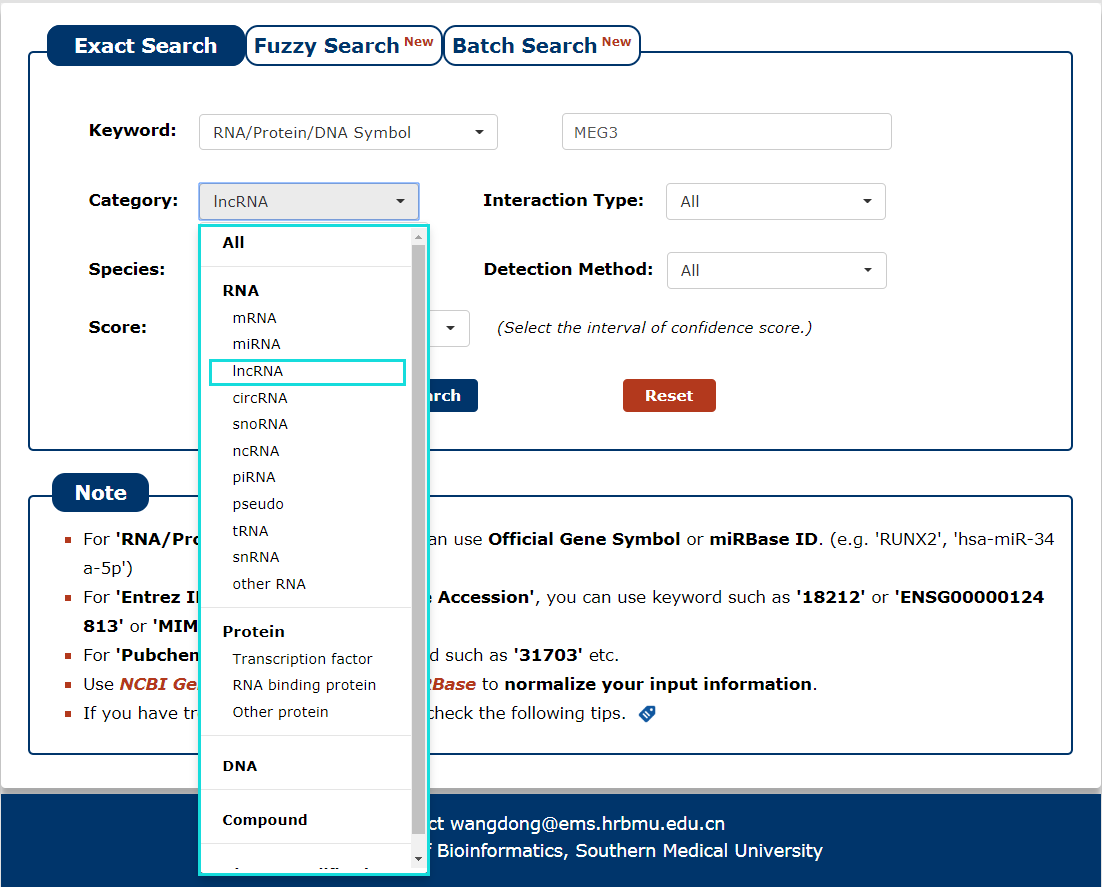
Fig 3-3
4. The next step is to choose the type of interaction. If you want to search for interaction of proteins with a particular RNA, you can choose 'RNA-Protein interaction'. In this example, we choose 'RNA-Protein interaction'. Under this condition, we can get RNA('MEG3')-protein interactions.
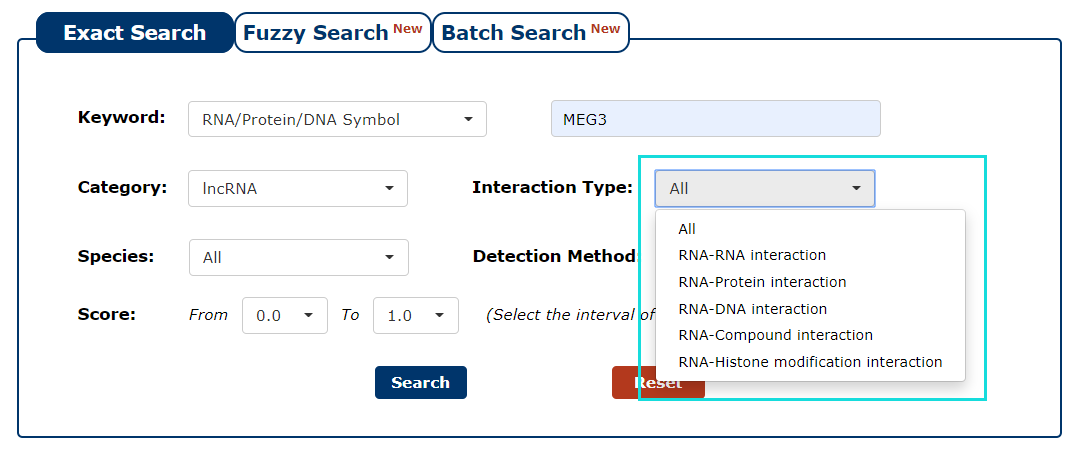
Fig 3-4
5. Then select the species for the keyword you entered. In this example, we choose 'Homo sapiens' as the species of the keyword 'MEG3'.
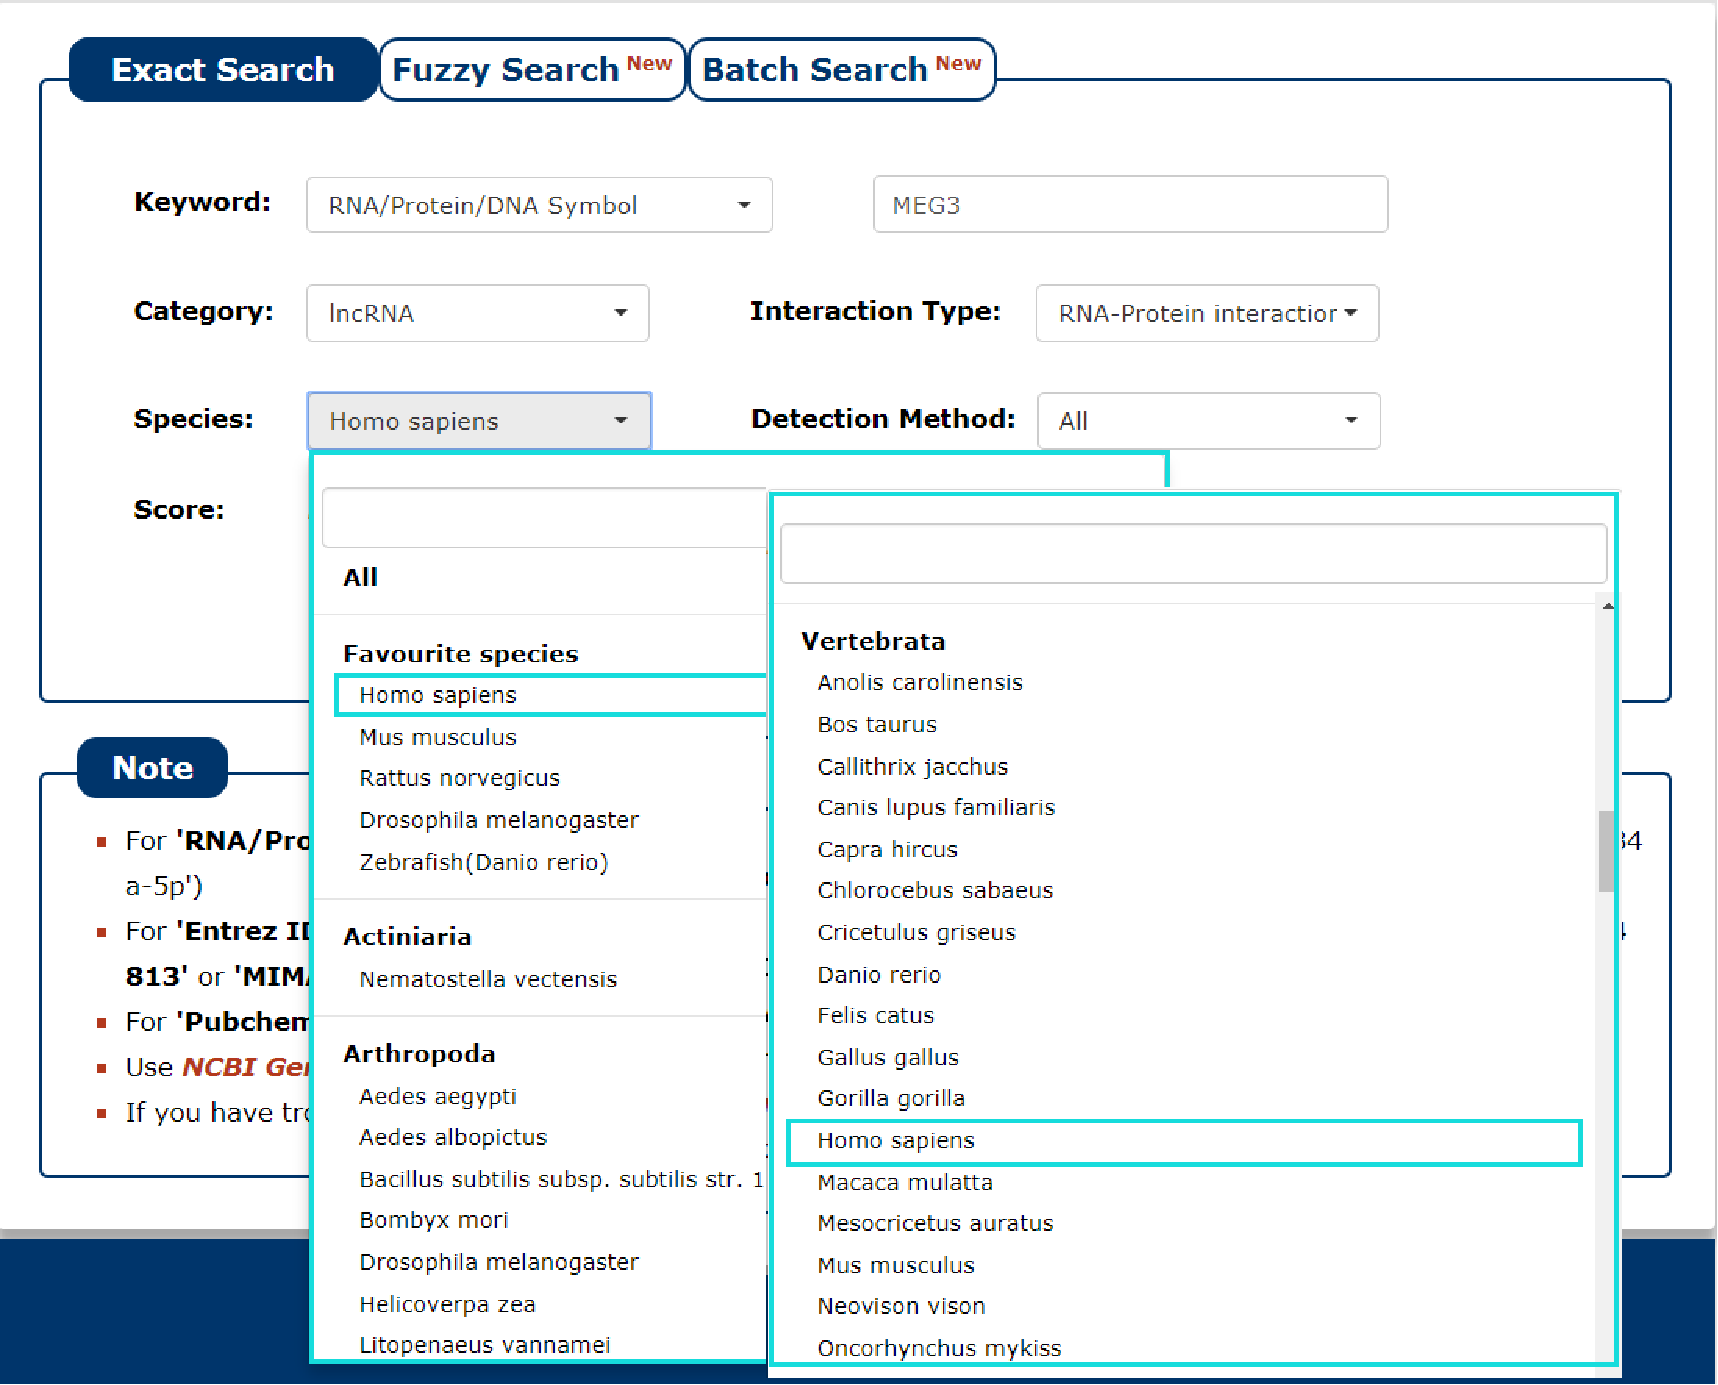
Fig 3-5
6. You can also choose the type of method that detects interaction as the filter. In this example, we want query the interaction detected by strong experimental evidence, so we choose 'Strong Experimental Evidence'.
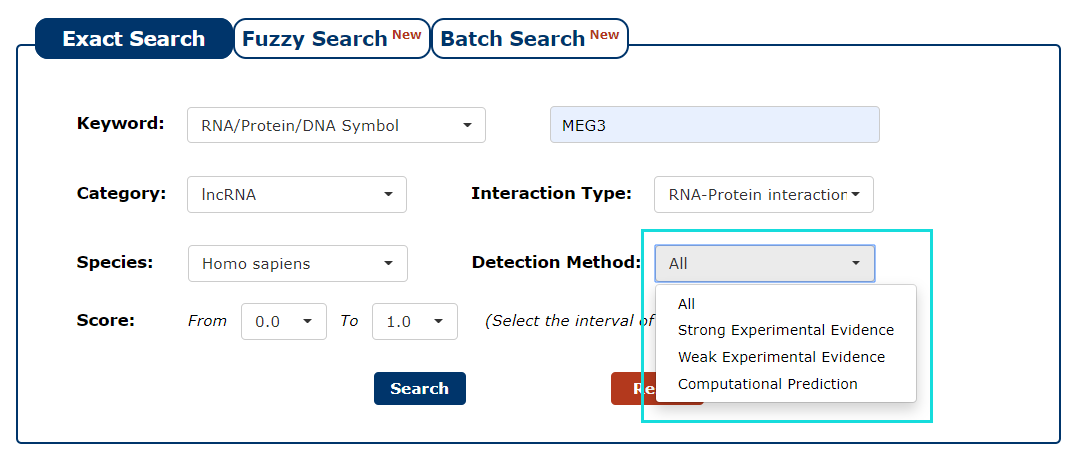
Fig 3-6
7. We provide a score for each interaction. The greater the value, the higher the credibility. To filter low-confidence interactions, in this example, we choose the 0.5 as the minimum score and 1.0 as the maximum score.
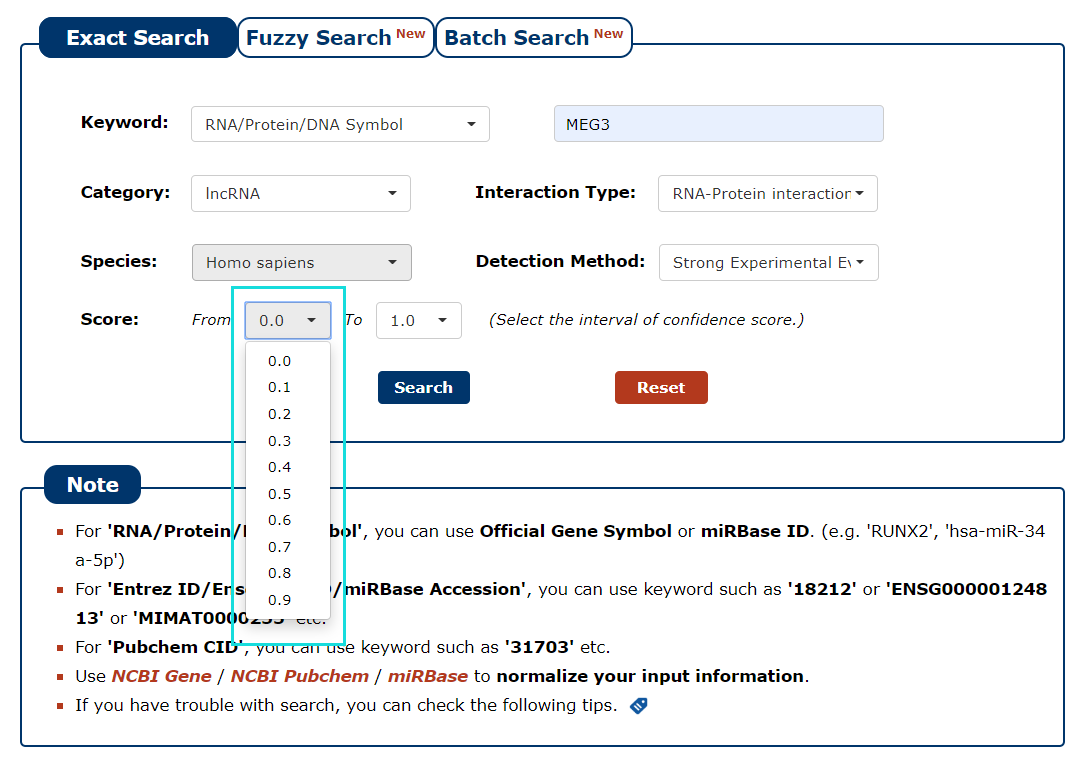
Fig 3-7
8. With all the filters above, we can click 'Search' to query the result.
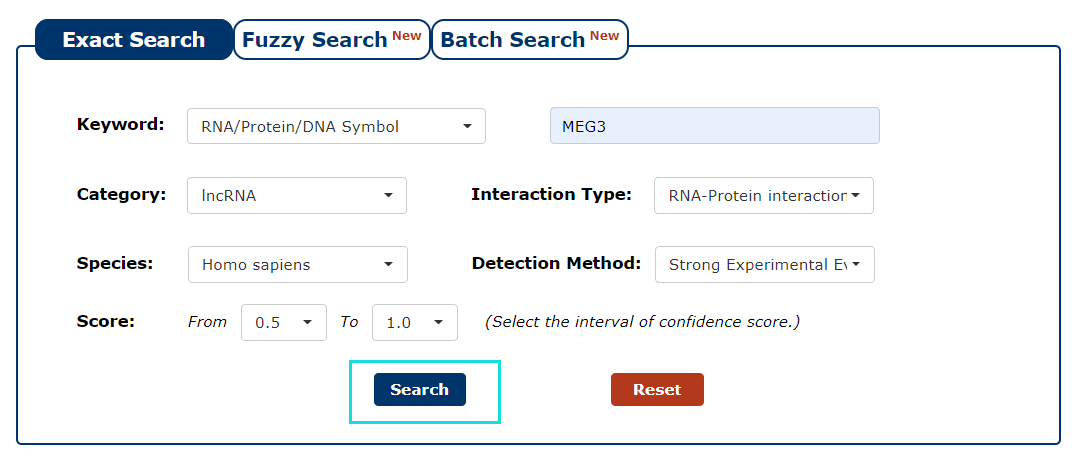
Fig 3-8
9. After several seconds, the result will occur. All the interactions are represented in th table format, and your filters and the total numbers of interactions are in the head of the web page.
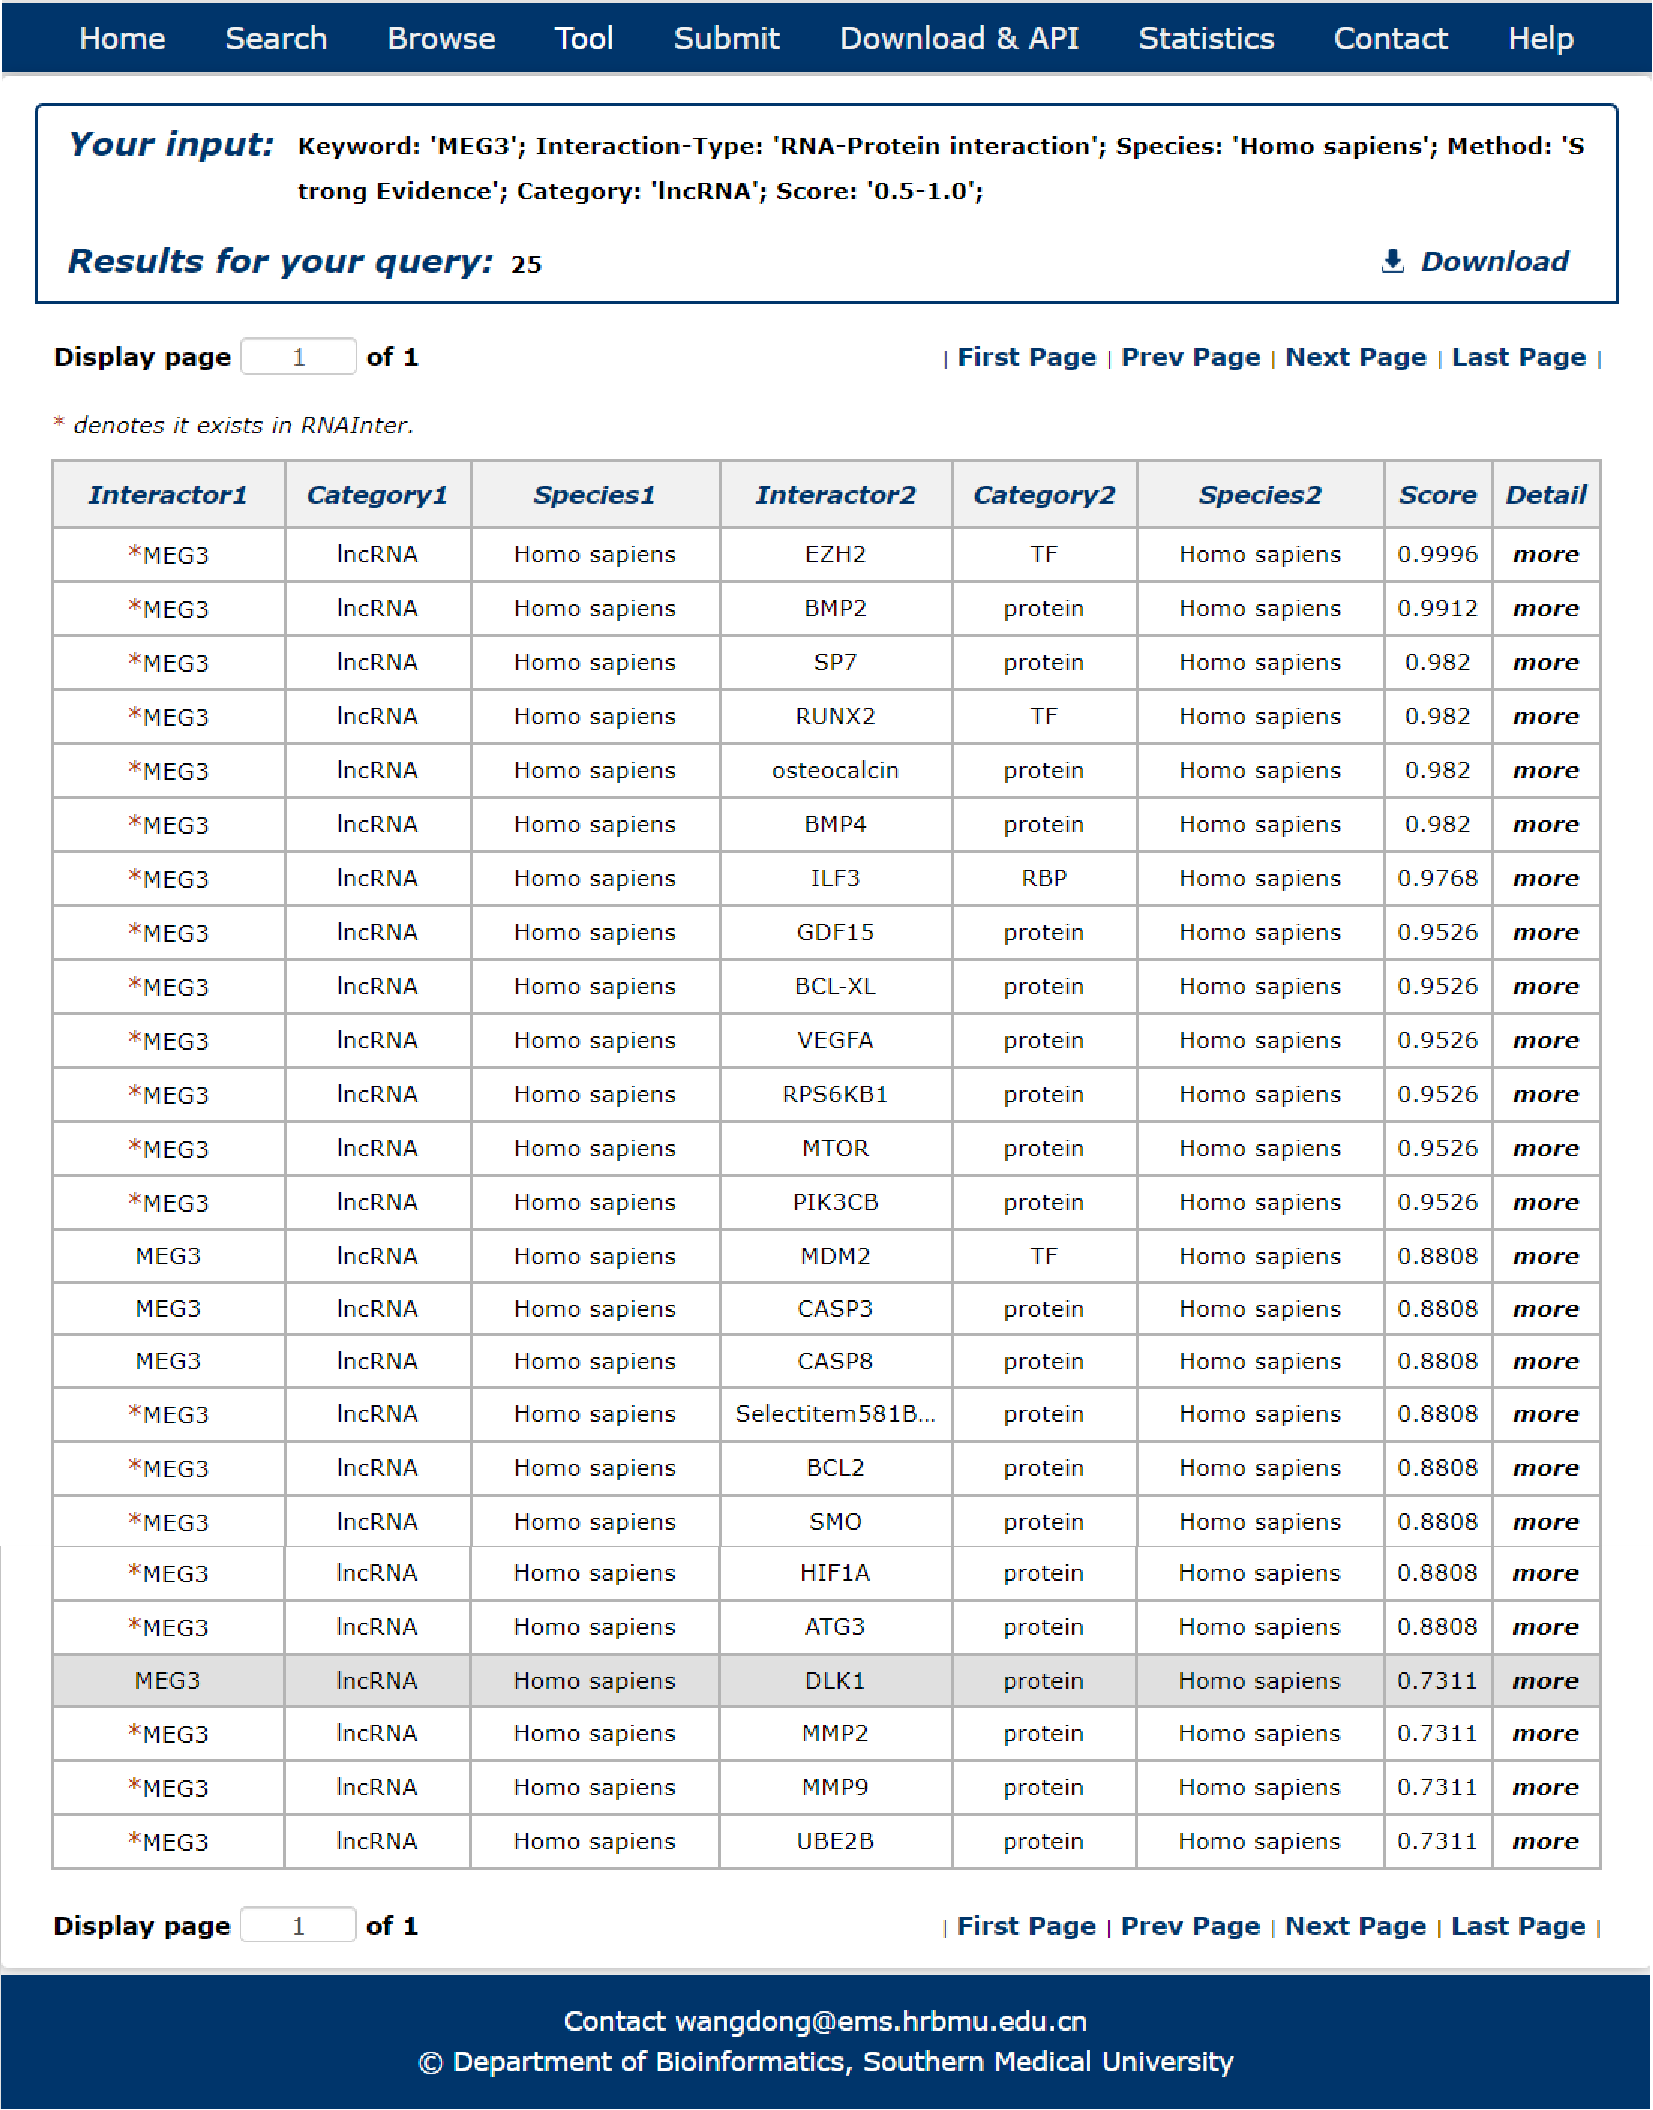
Fig 3-9
In the result page, all entries are listed with basic information including Interactor symbols, molecular categories, species and score.
Fig 4-1:
1. Your current input conditions.
2. Total sum of results.
3. Download your search results.
4. Click to turn the page.
5. Click any interactor as a keyword to search in RNAInter database.
6. Click to link to detail page.
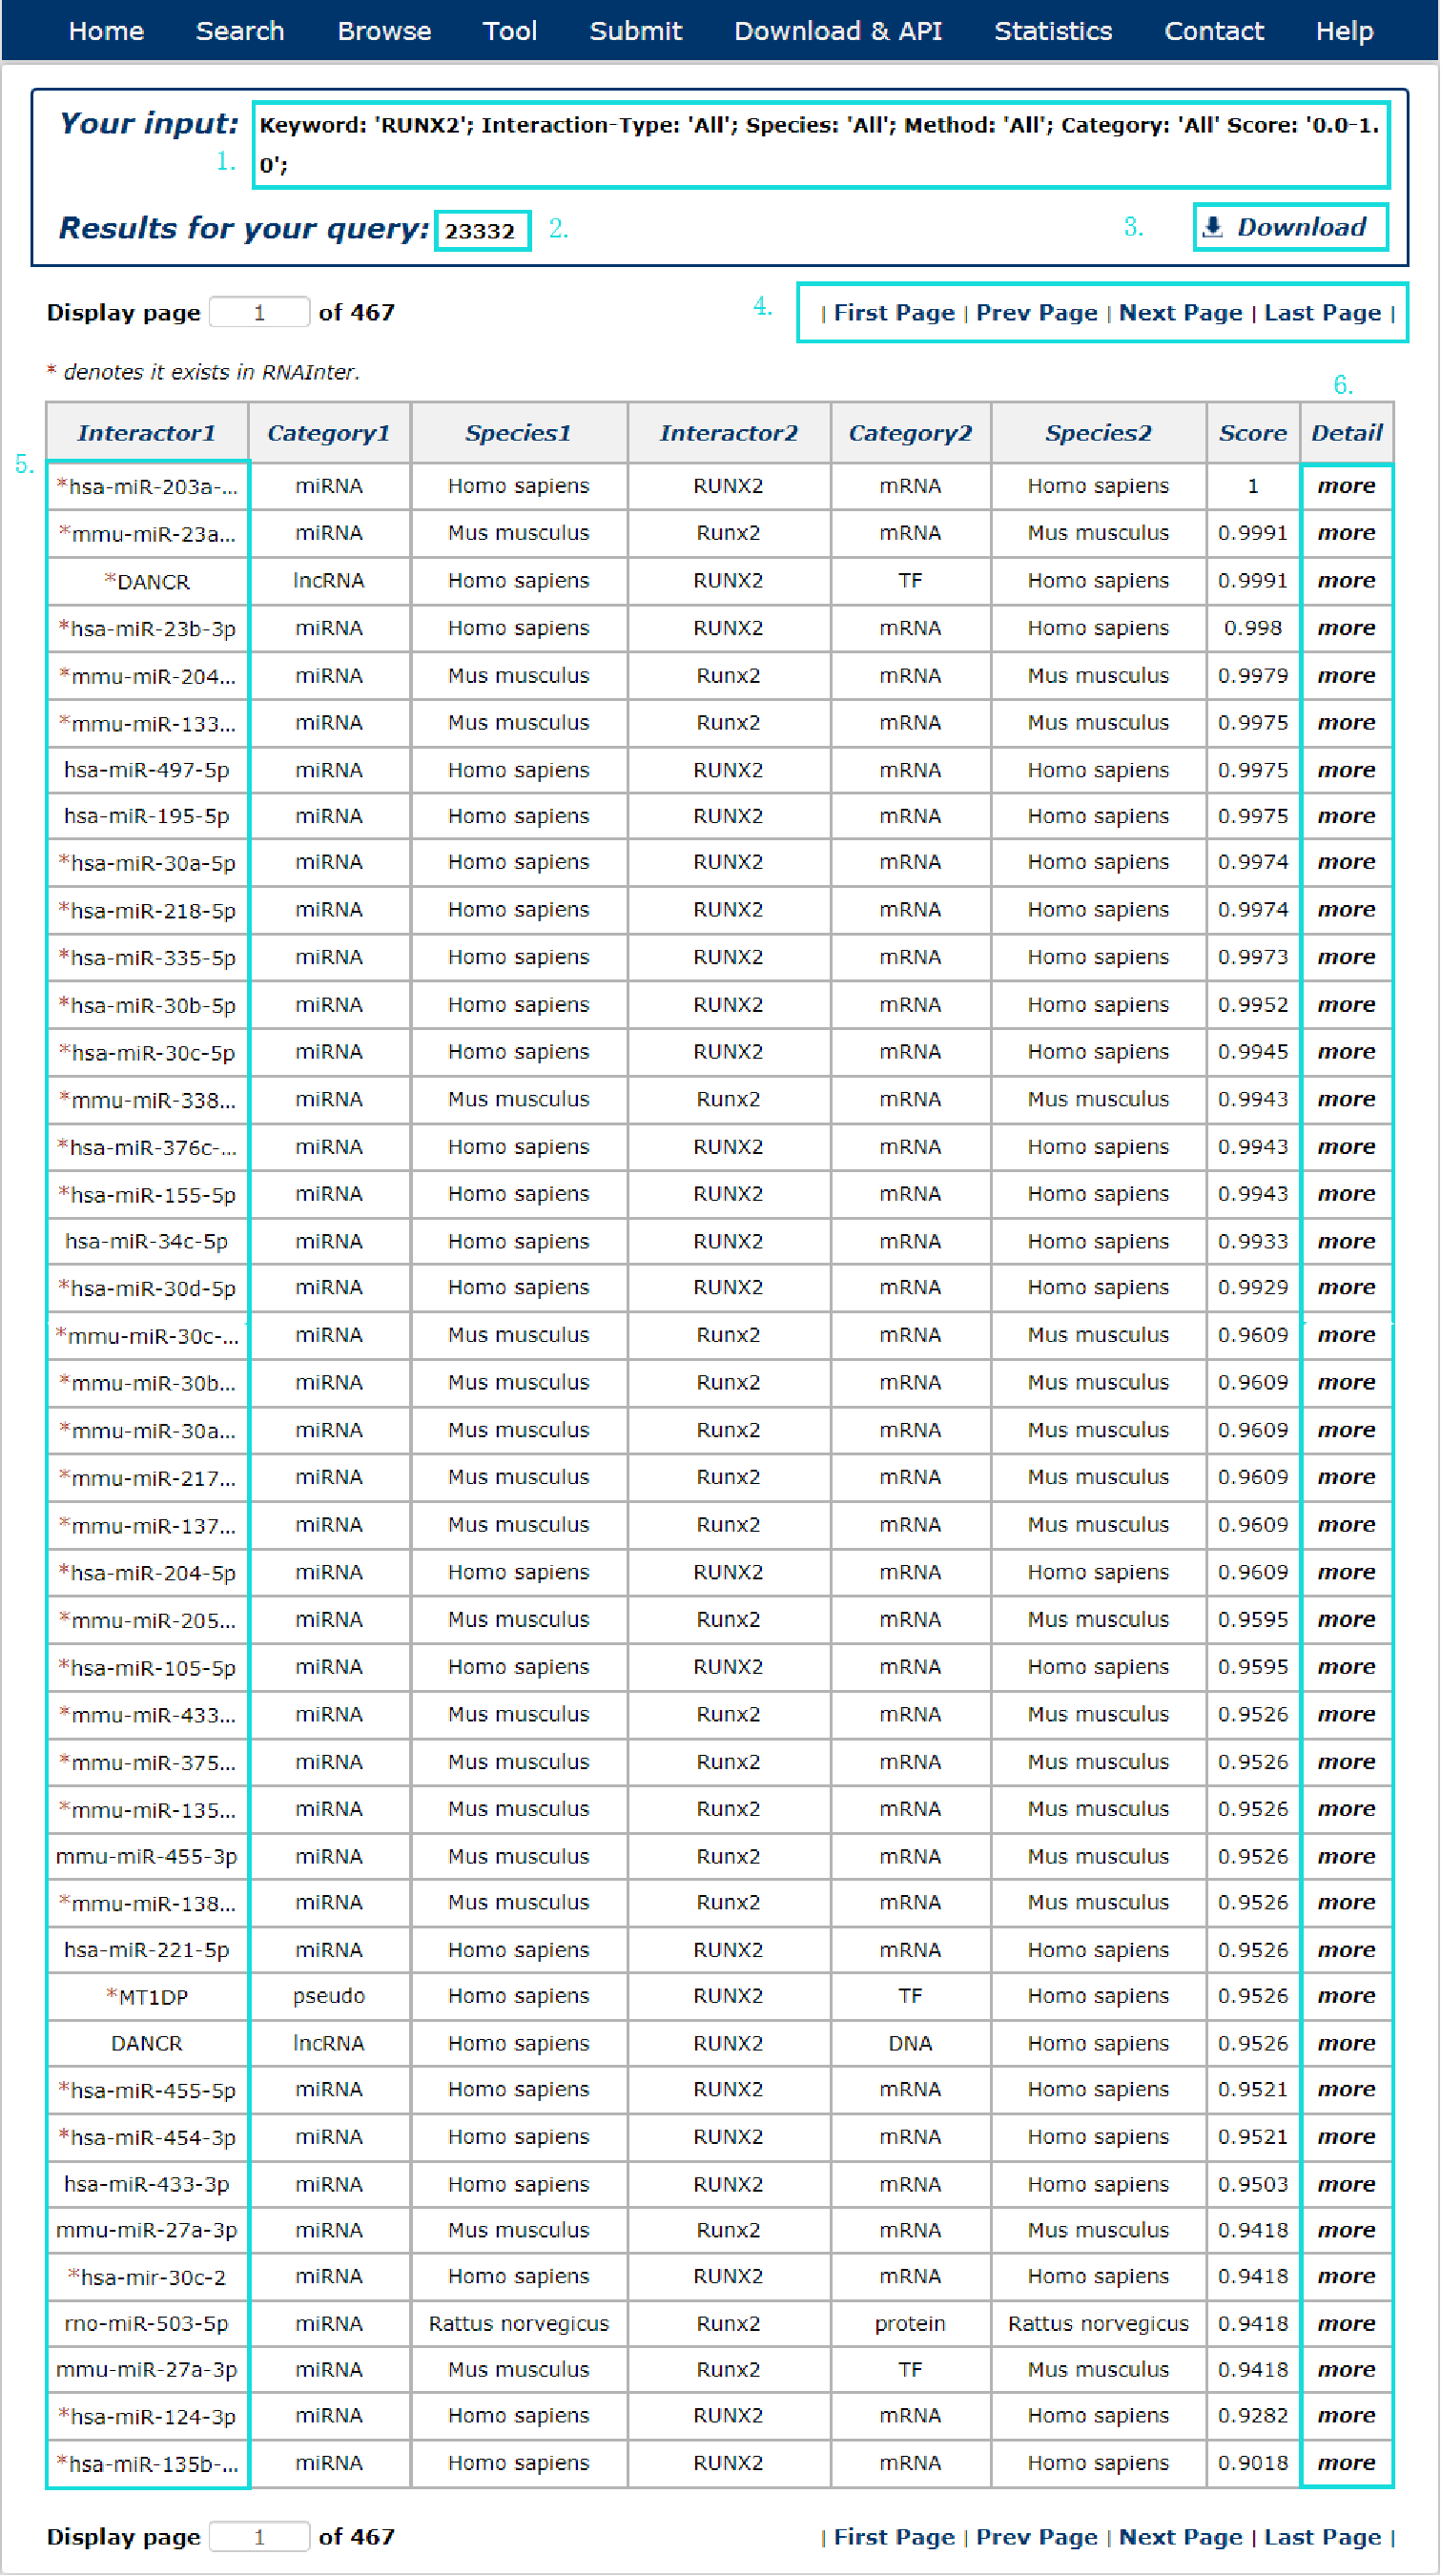
Fig 4-1 Result page
Firstly, you can get general information including RNAInter ID, confidence score, interaction type and predicted binding sites in the detail page.
Second, you can also get the basic information, homology interaction, target region information, evidence support and references of each entry.
Thrid, the association of RNA editing, localization, modification and structure also been provided.
Fourth, the interaction network and the dynamic expression of interactors in spermatogenesis and haematopoietic stem cell of each entry has been represented in RNAInter.
Fig 5-1:
For RNA-RNA interactions, users can choose any union of two transcript accessions and click to see results displayed either by miRanda or RIsearch.
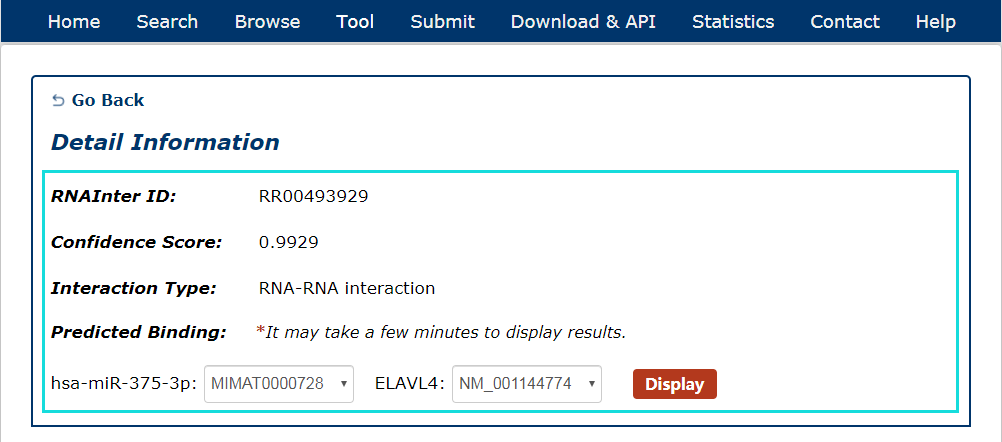
Fig 5-1 Detail page of RNA-RNA interaction.
Fig 5-2:
1. For RNA-Protein interactions, users can choose any protein sequence accession and click to see results displayed by PRIdictor.
2. Users can also get RNA-binding sites in proteins documented in RBPDB, RsiteDB and PDB.
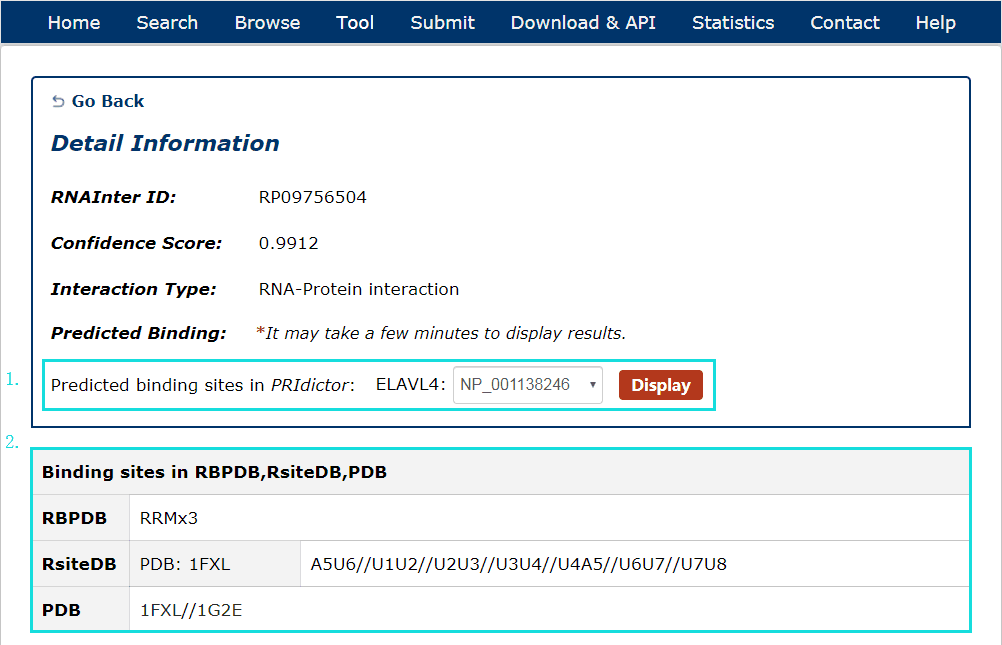
Fig 5-2 Detail page of RNA-Protein interaction.
Fig 5-3:
1. Click any interactor as a keyword to search in database.
2. Click Entrez ID/miRBase Accession/Ensembl GID/PubChem CID to see its basic description in NCBI Gene/miRBase/Ensembl/NCBI PubChem Compound database.
3. Category, UniProt, aliases, other ids and description of each interactor symbol.
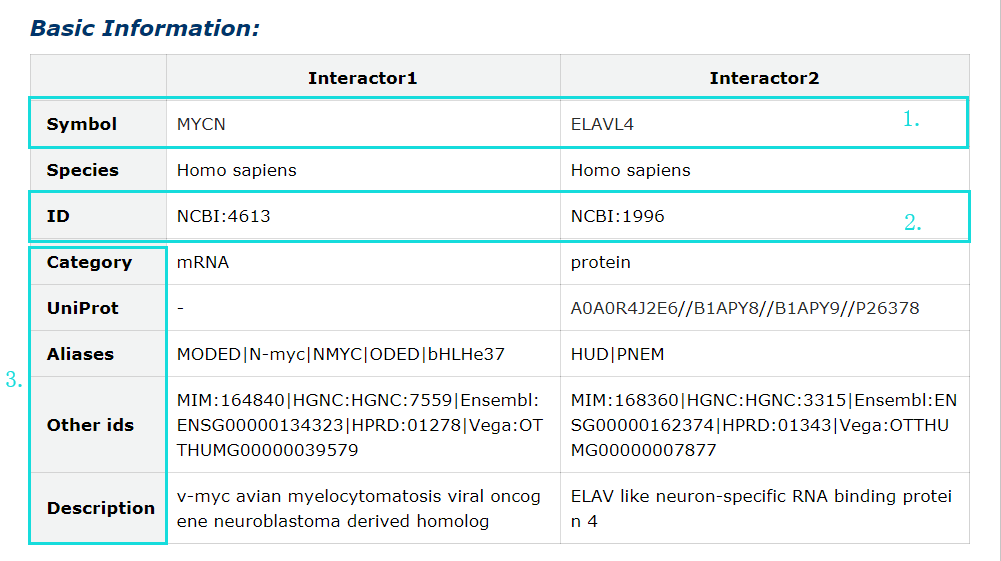
Fig 5-3 Detail page of basic information
Fig 5-4:
Homology interactions of each entry also in our database were provided. Click RNAInter ID can see more informations about them.
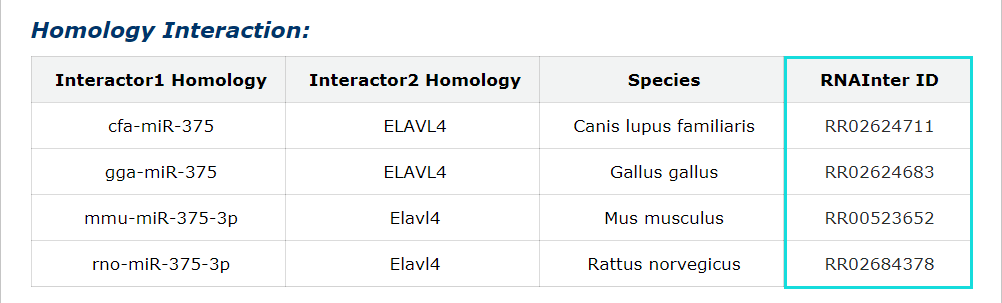
Fig 5-4 Detail page of Homology interactions
Fig 5-5:
The target region, data accession and sample resource from literature or high-throughput sequencing data for each interaction were provided.
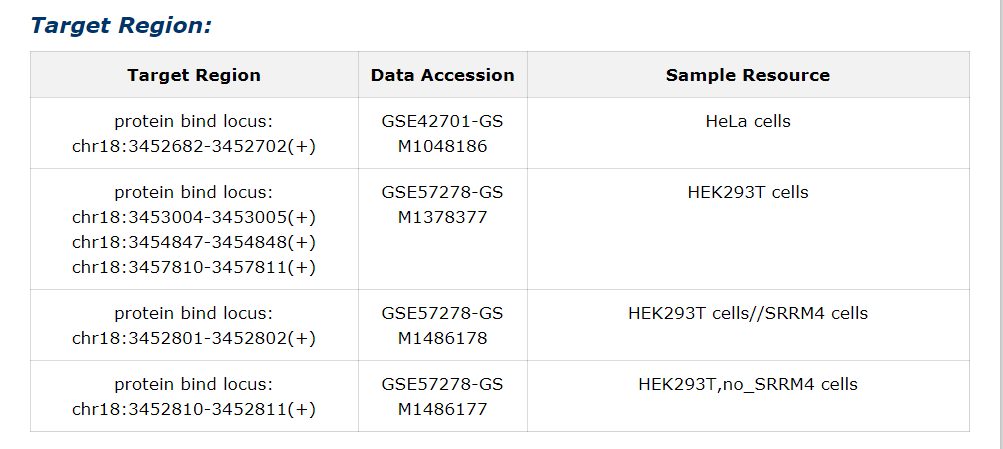
Fig 5-5 Detail page of Target Region
Fig 5-6:
1. RNA editing information from three source is provided.
2. For Lncediting, provide editing position.
3. For RADAR, provide editing position, change and genetic region. Each editing position link to RADAR detail information page.
4. For DARNED, prvide editing position, change, seqReg, exReg and PubMed ID. Each editing position link to DARNED.
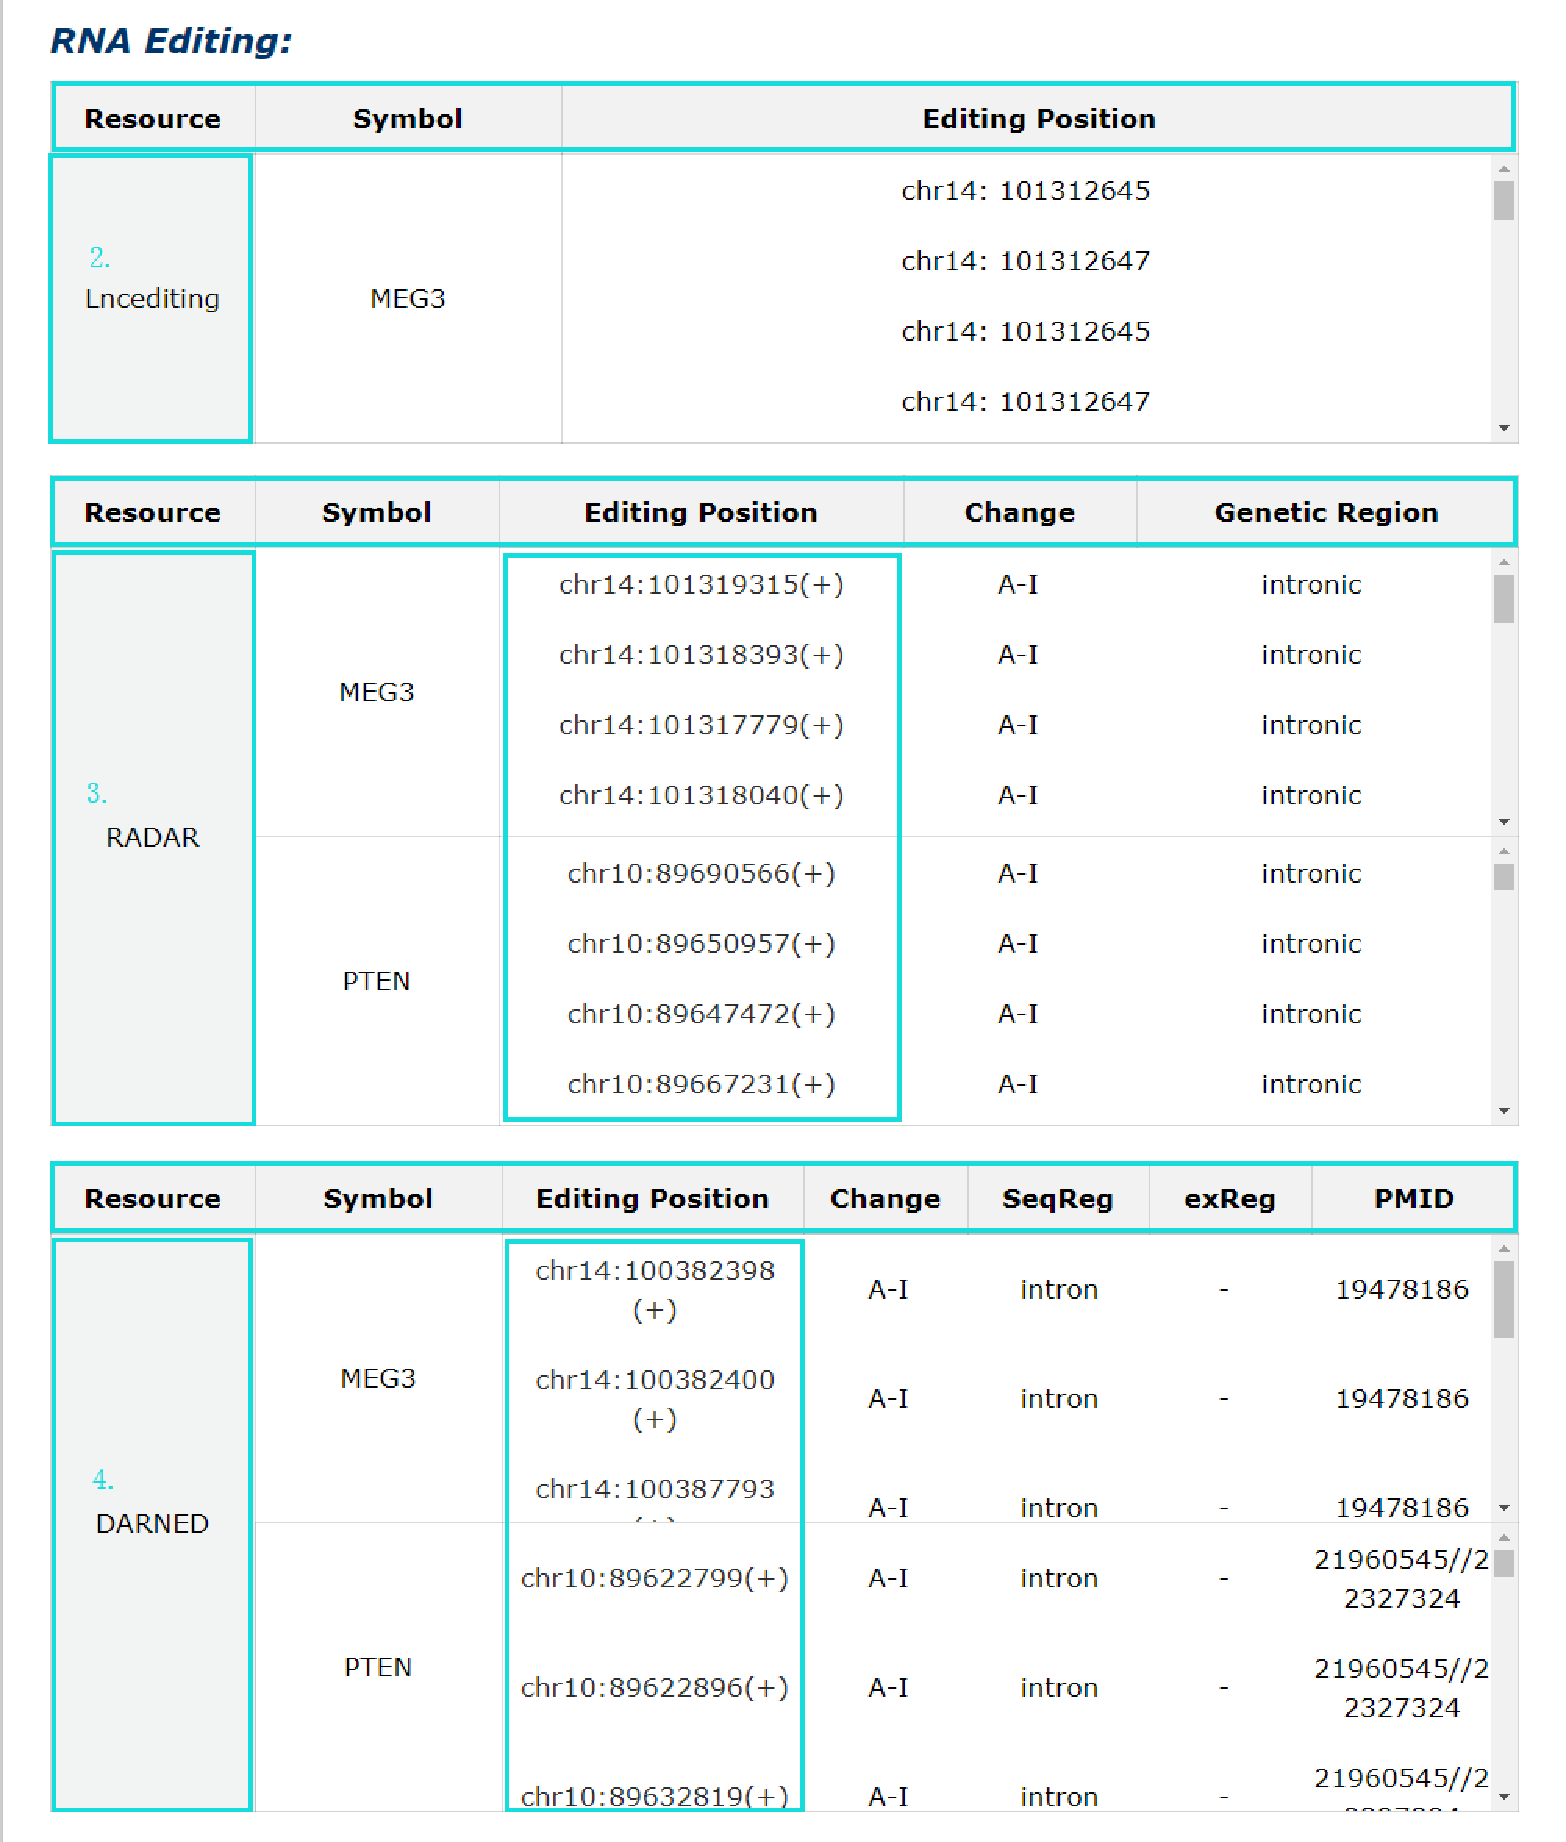
Fig 5-6 Detail page of RNA editing
Fig 5-7:
RNA localization information from RNALocate is provided, include symbol, subcellular localization, tissue or cell line, PMID. Click each subcellular localization can jump to RNALocate database.
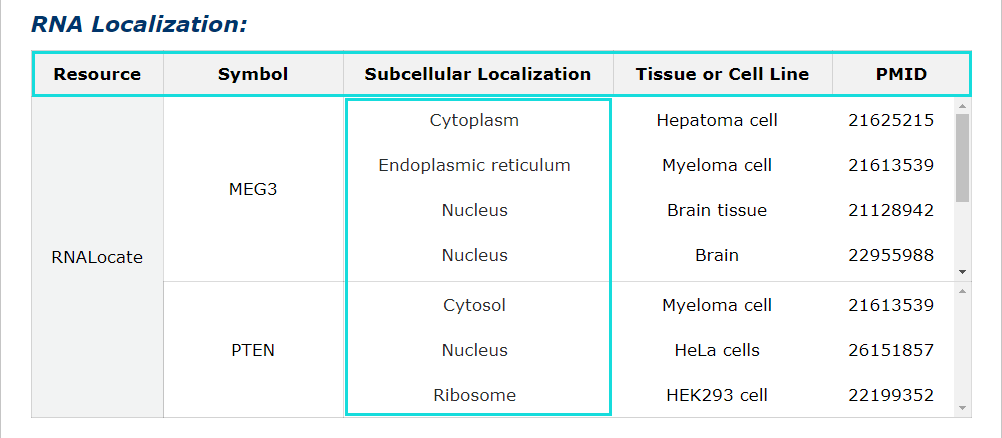
Fig 5-7 Detail page of RNA localization
Fig 5-8:
RNA modification information from RMBase is provided, include modification positions, modification types and genomic contexts for each RNA symbol.Click each modification position can get more detail information in RMBase detail page.
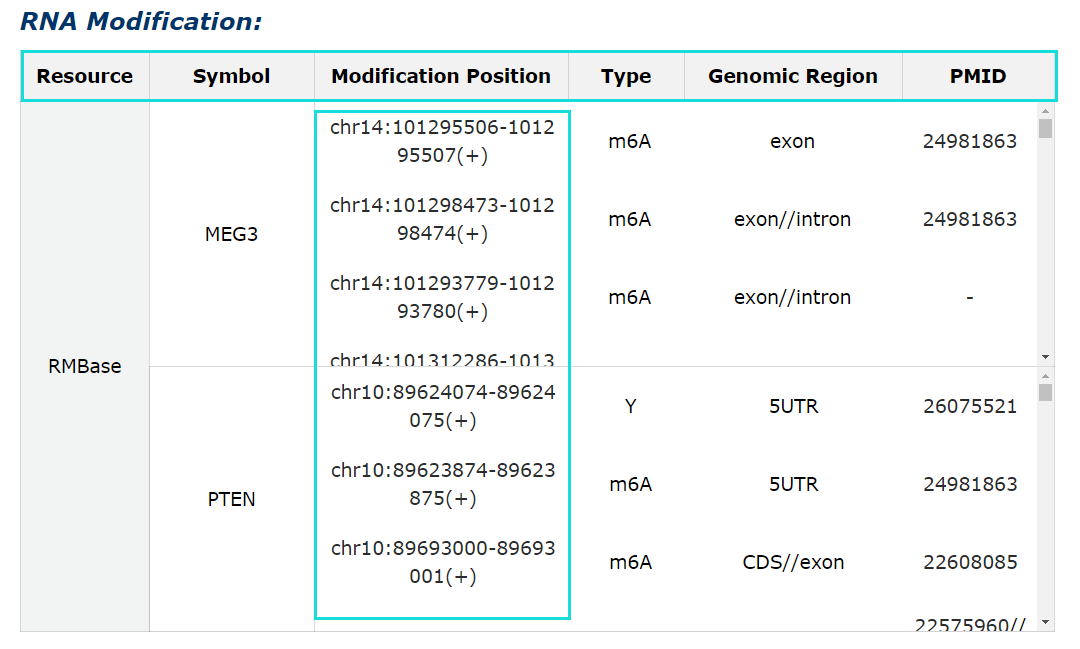
Fig 5-8 Detail page of RNA modification
Fig 5-9:
RNA secondary structure by the prediction tool of RNA structure is provided. Select any transcript accession to see its secondary structure.
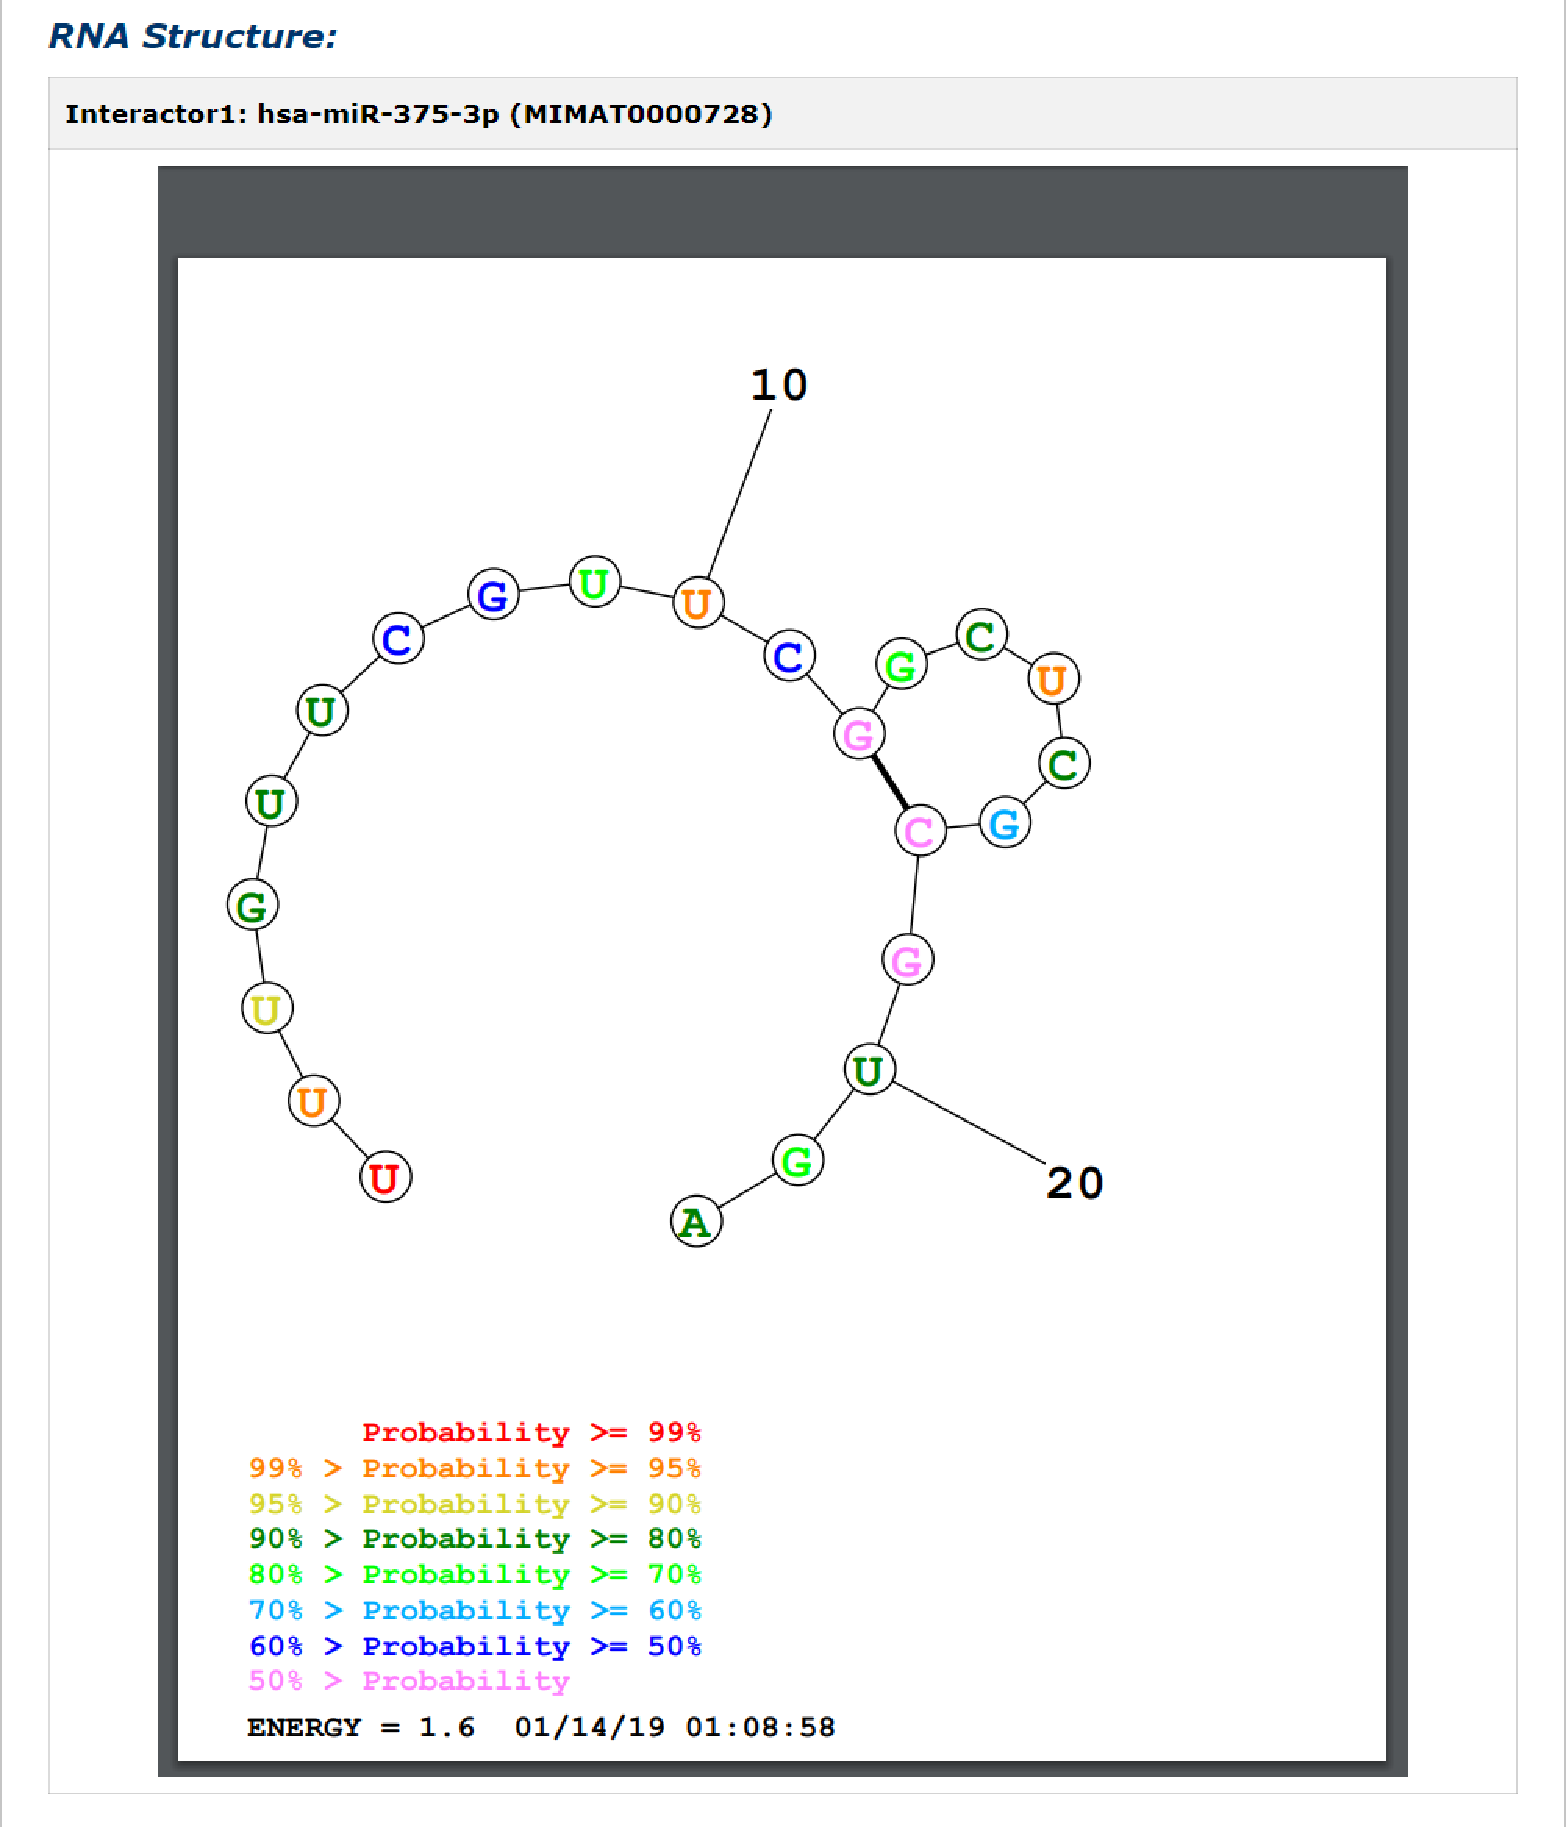
Fig 5-9 Detail page of RNA secondary structure
Fig 5-10:
1. Evidence support including four parts: strong evidence, weak evidence, prediction evidence and support database.
2. The source of database, tissue or cell line and description of each entry.
3. Click pubmed ID to see description in detail.
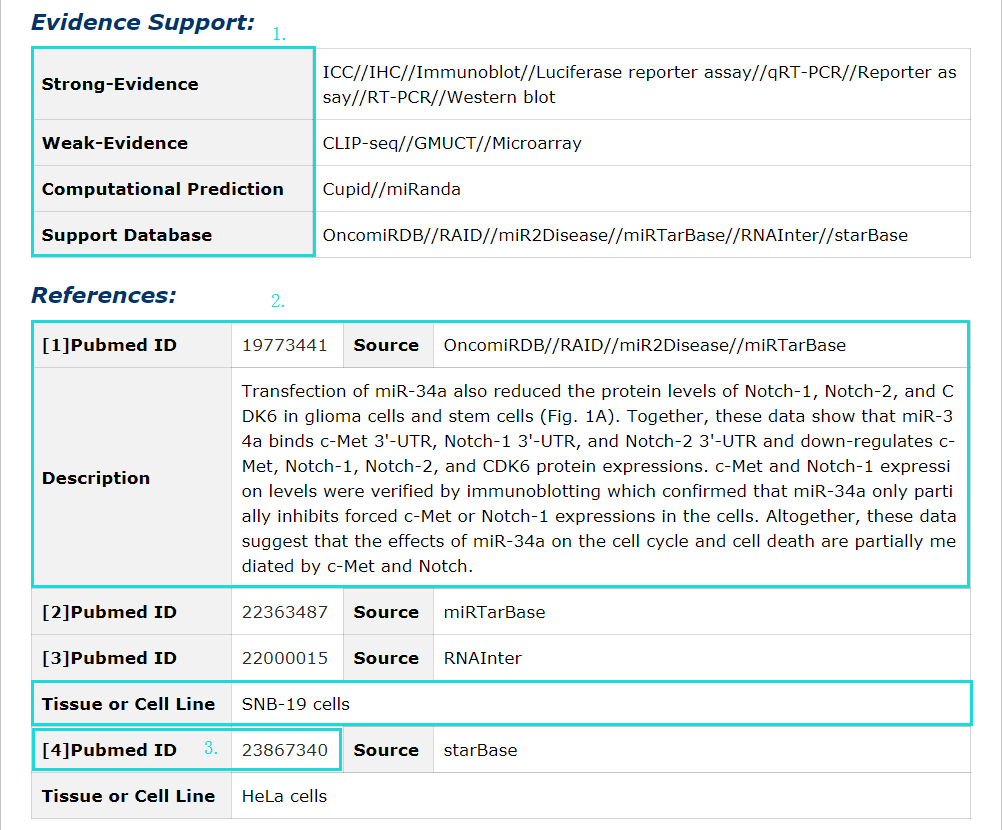
Fig 5-10 Detail page of evidence support
Fig 5-11:
1. Provide interaction network for each interactor( show the top 100 interactions ranked by confidence score in our database ).
2. Click each iron can drop this interactor category during generate network plot.
3. Click each edge will redirect to corresponding detail page of interaction data.
4. The interaction network plot can be download.
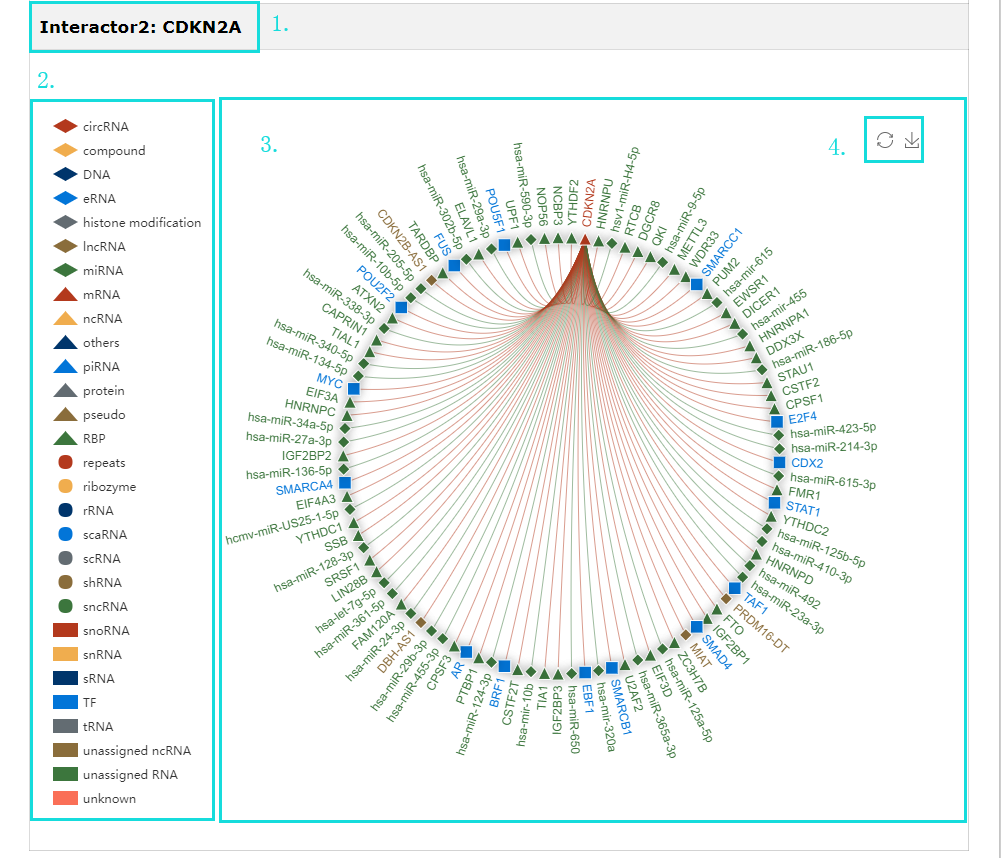
Fig 5-11 Detail page of Interactor Networks
Fig 5-12:
The dynamic expression of interactor(s) in spermatogenesis and HSC lineage commitment is provided.
1. The line graph shows the dynamic expression of one or two molecule in the process of human or mouse spermatogenesis, human haematopoietic stem cell lineage, and mouse embryonic haematopoietic stem cell formation.
2. Line with different color labels different molecule and their average pearson correlation coefficient when both molecules are expressed in spermatogenesis/HSC lineage commitment.
3. Table presents abbreviation, full name, pearson correlation coefficient of each stage of spermatogenesis/HSC lineage commitment.
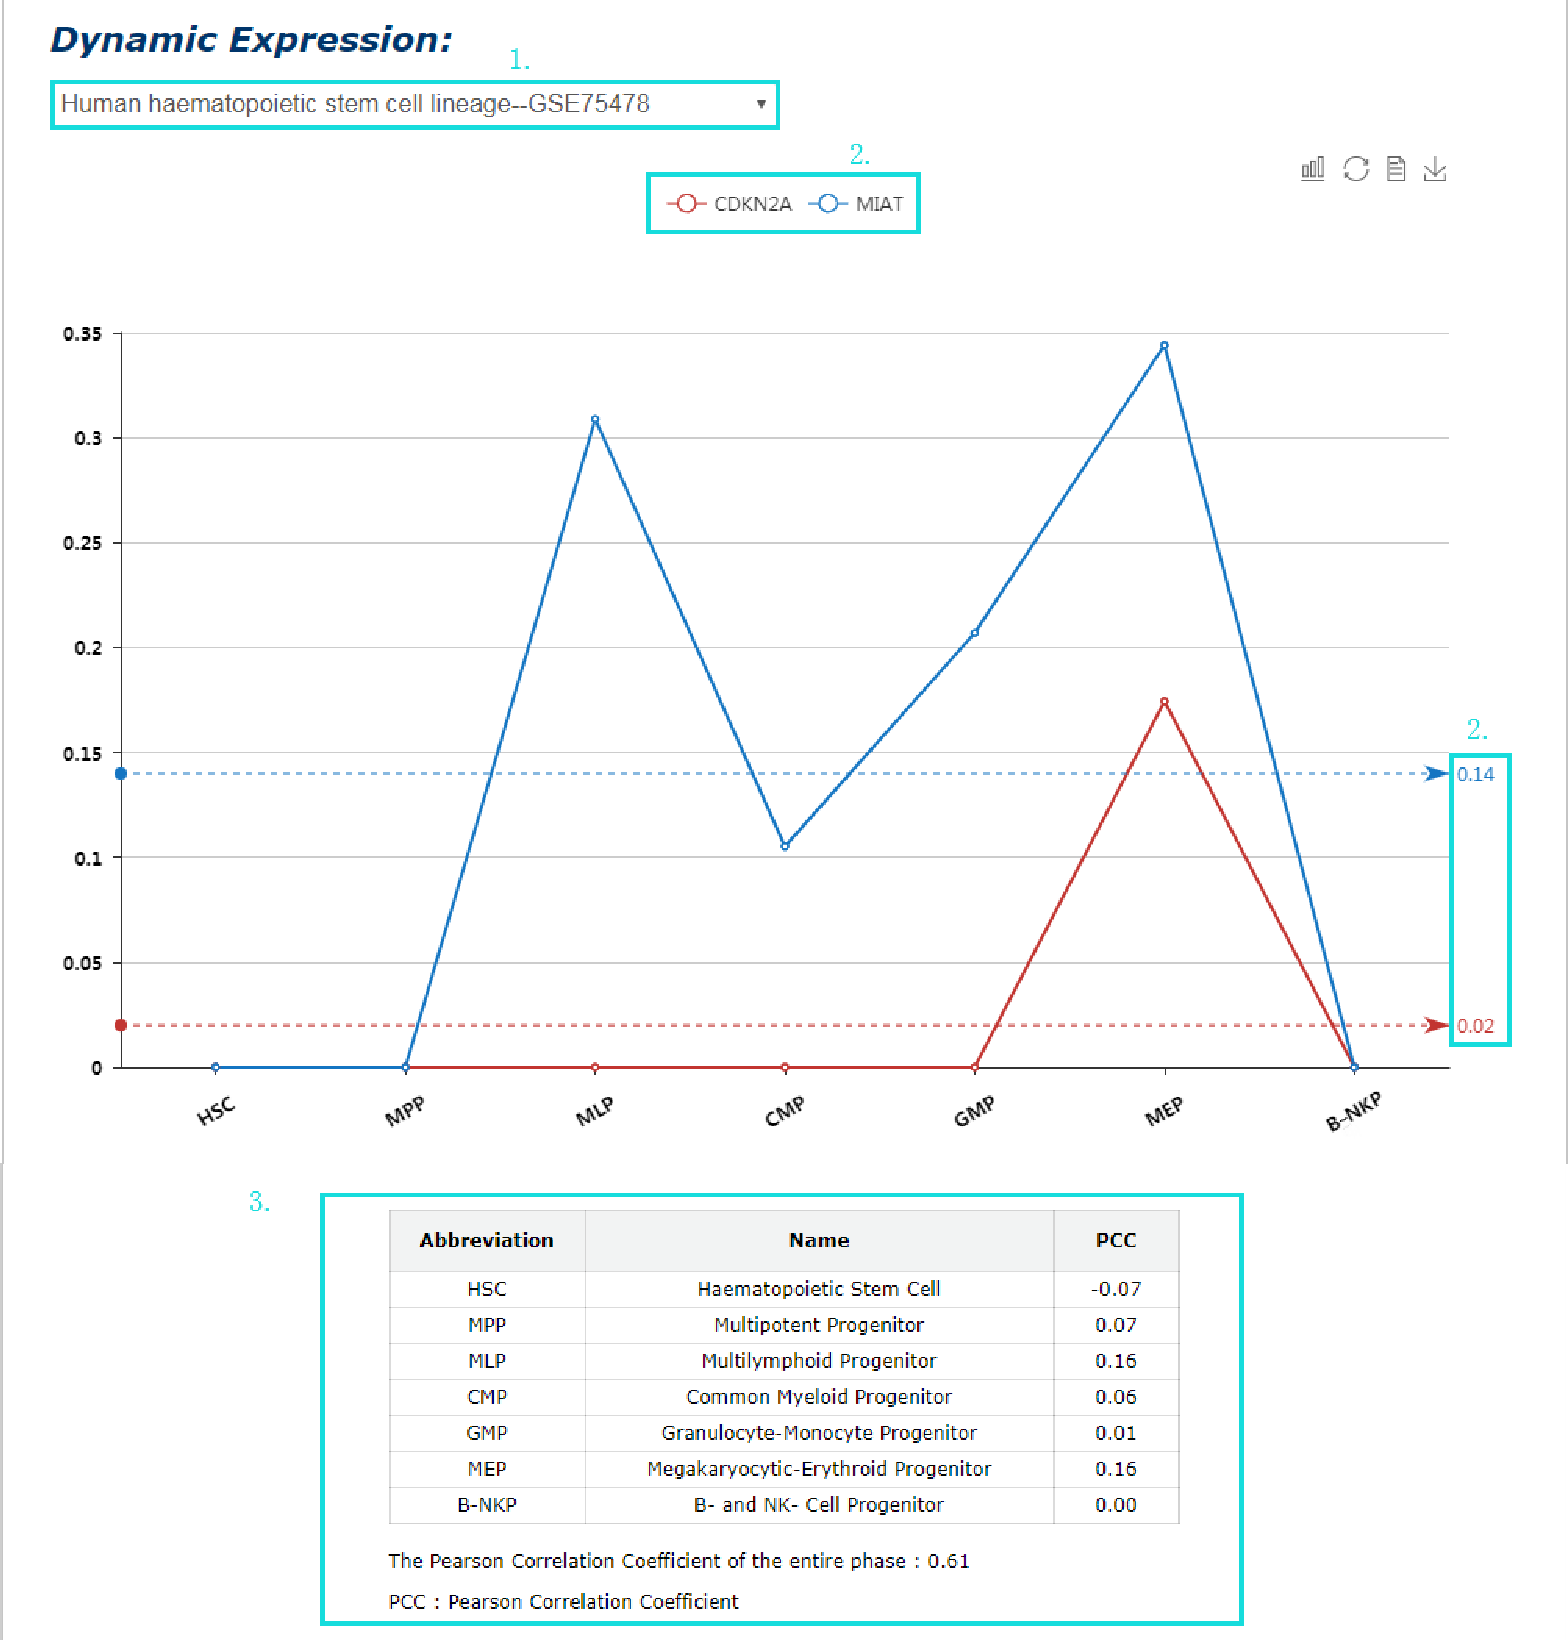
Fig 5-12 Detail page of dynamic expression
In the browse page, you can click each node to see results.
1. 'Interaction type' indicates the category of all interactors.
2. 'Detection methods' display all entries as long as the current selected method is involved.
3. 'Species' display all entries as long as one molecule's organism matches the condition.
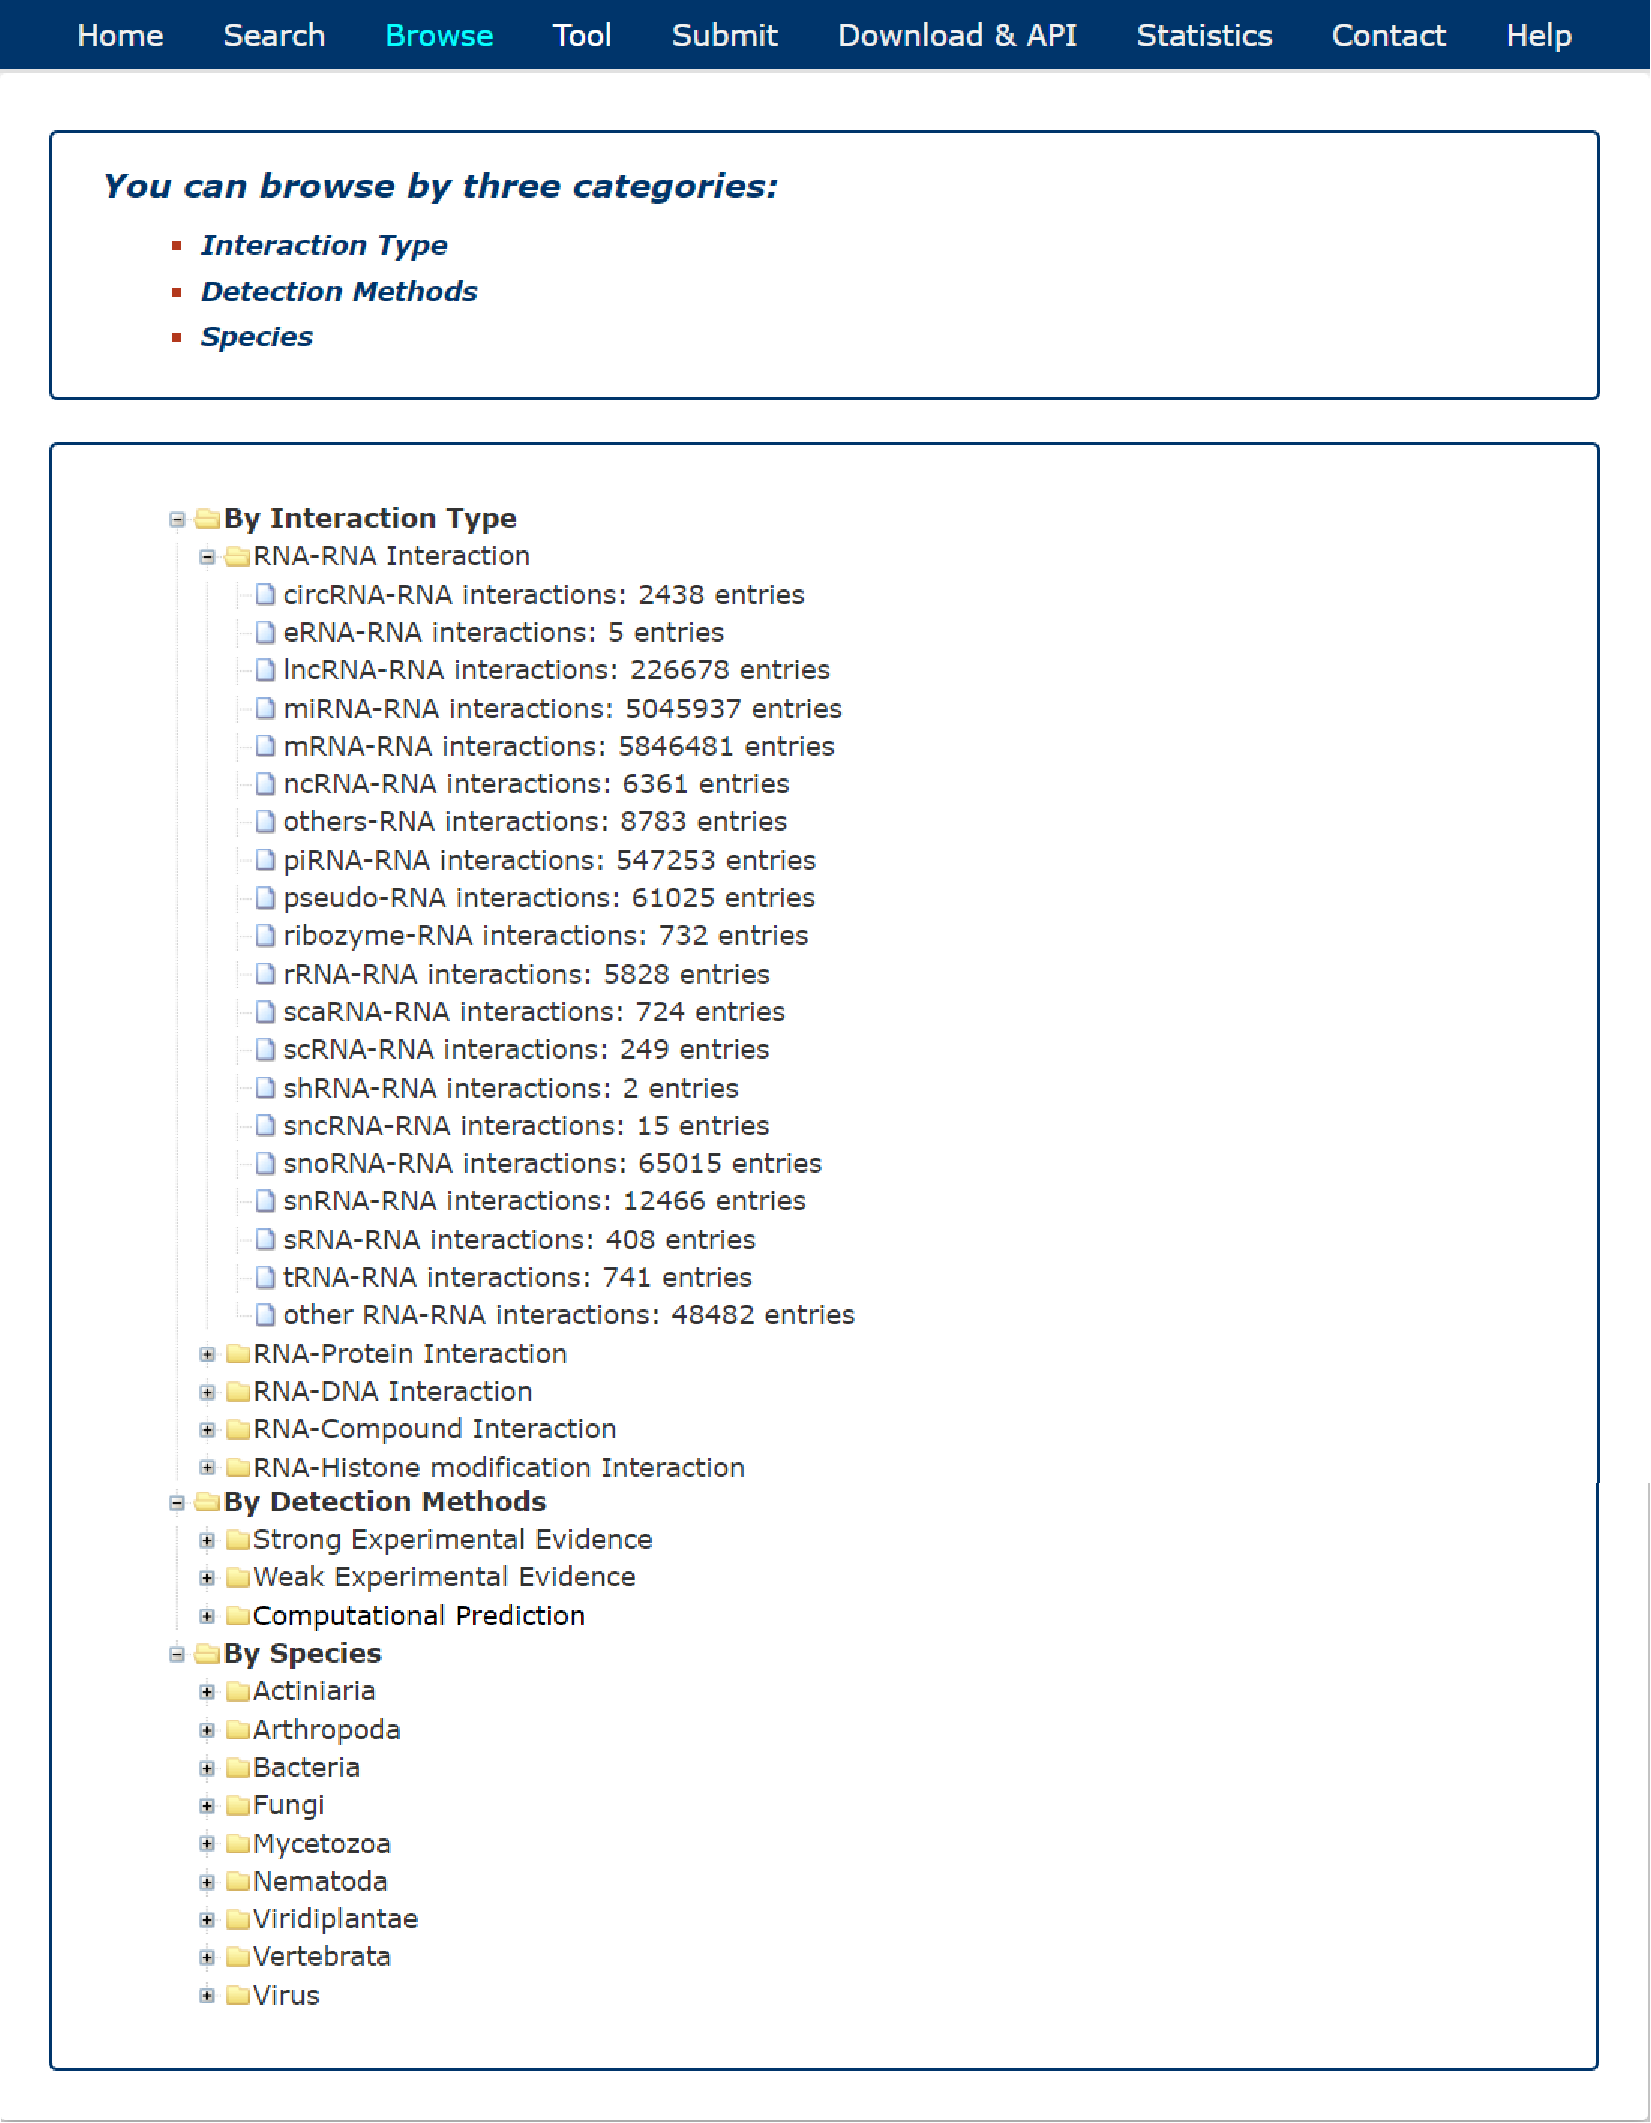
Fig 6-1 Browse page
Fig 7-1:
A tool for RNA-RNA interaction extraction from literatures is provided.
1. Support multiple input formats and different parameter selection.
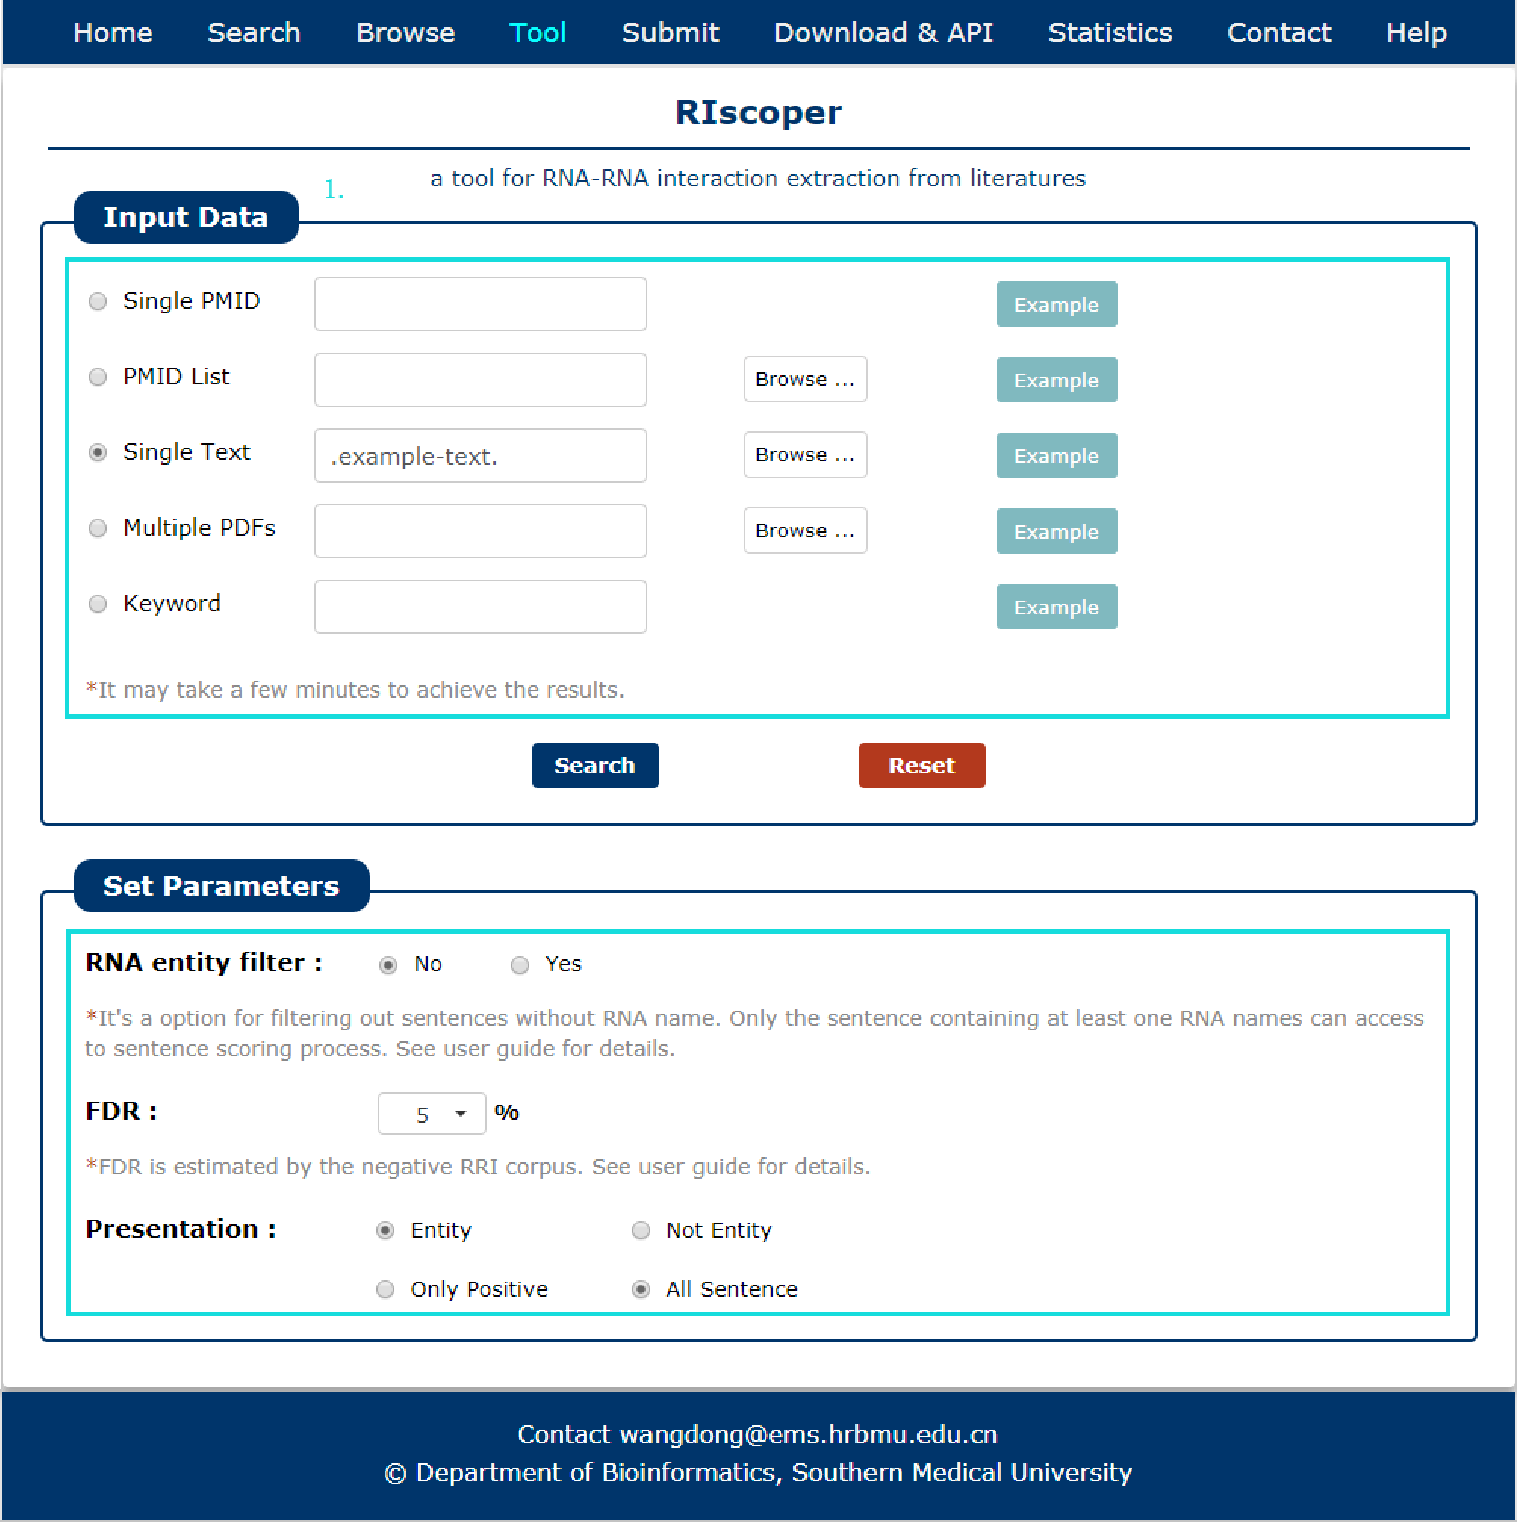
Fig 7-1 Tool of RIscoper
Fig 7-2:
The search results include PubMed ID, sentence, entity and score.
1. Each search result can be download.
2. The result can be sorted by score.
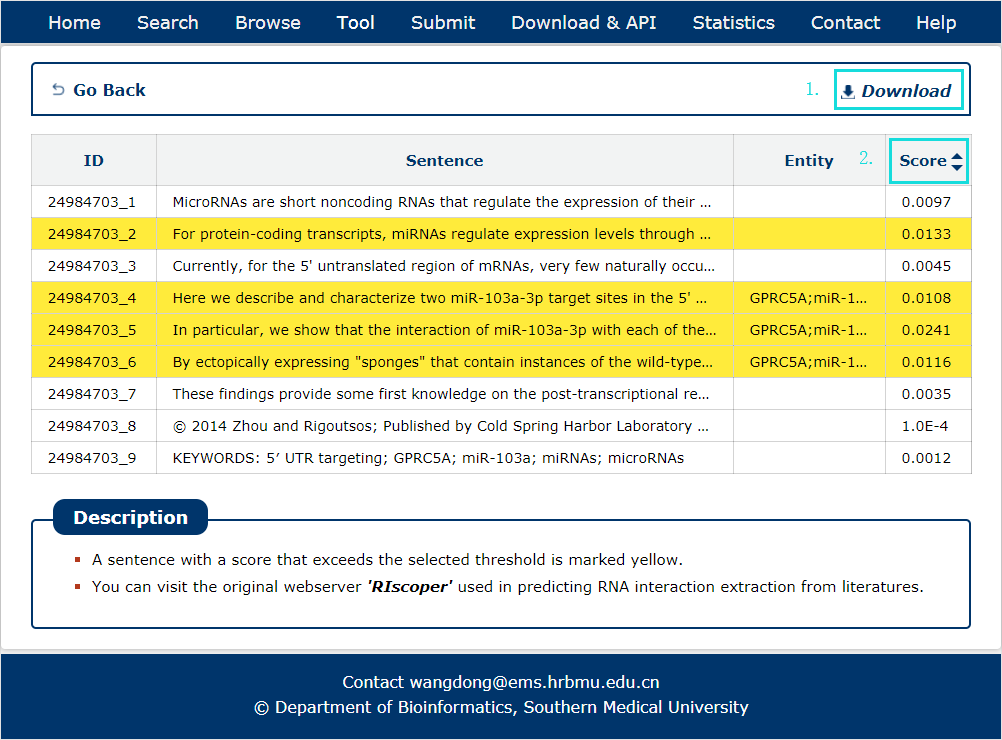
Fig 7-2 Result of RIscoper
Fig 8-1:
A program for the fast and accurate prediction of interactions between two RNA molecules is provided.
1. Input RNA sequences or upload files with FASTA format.
2. Select and check the parameters.
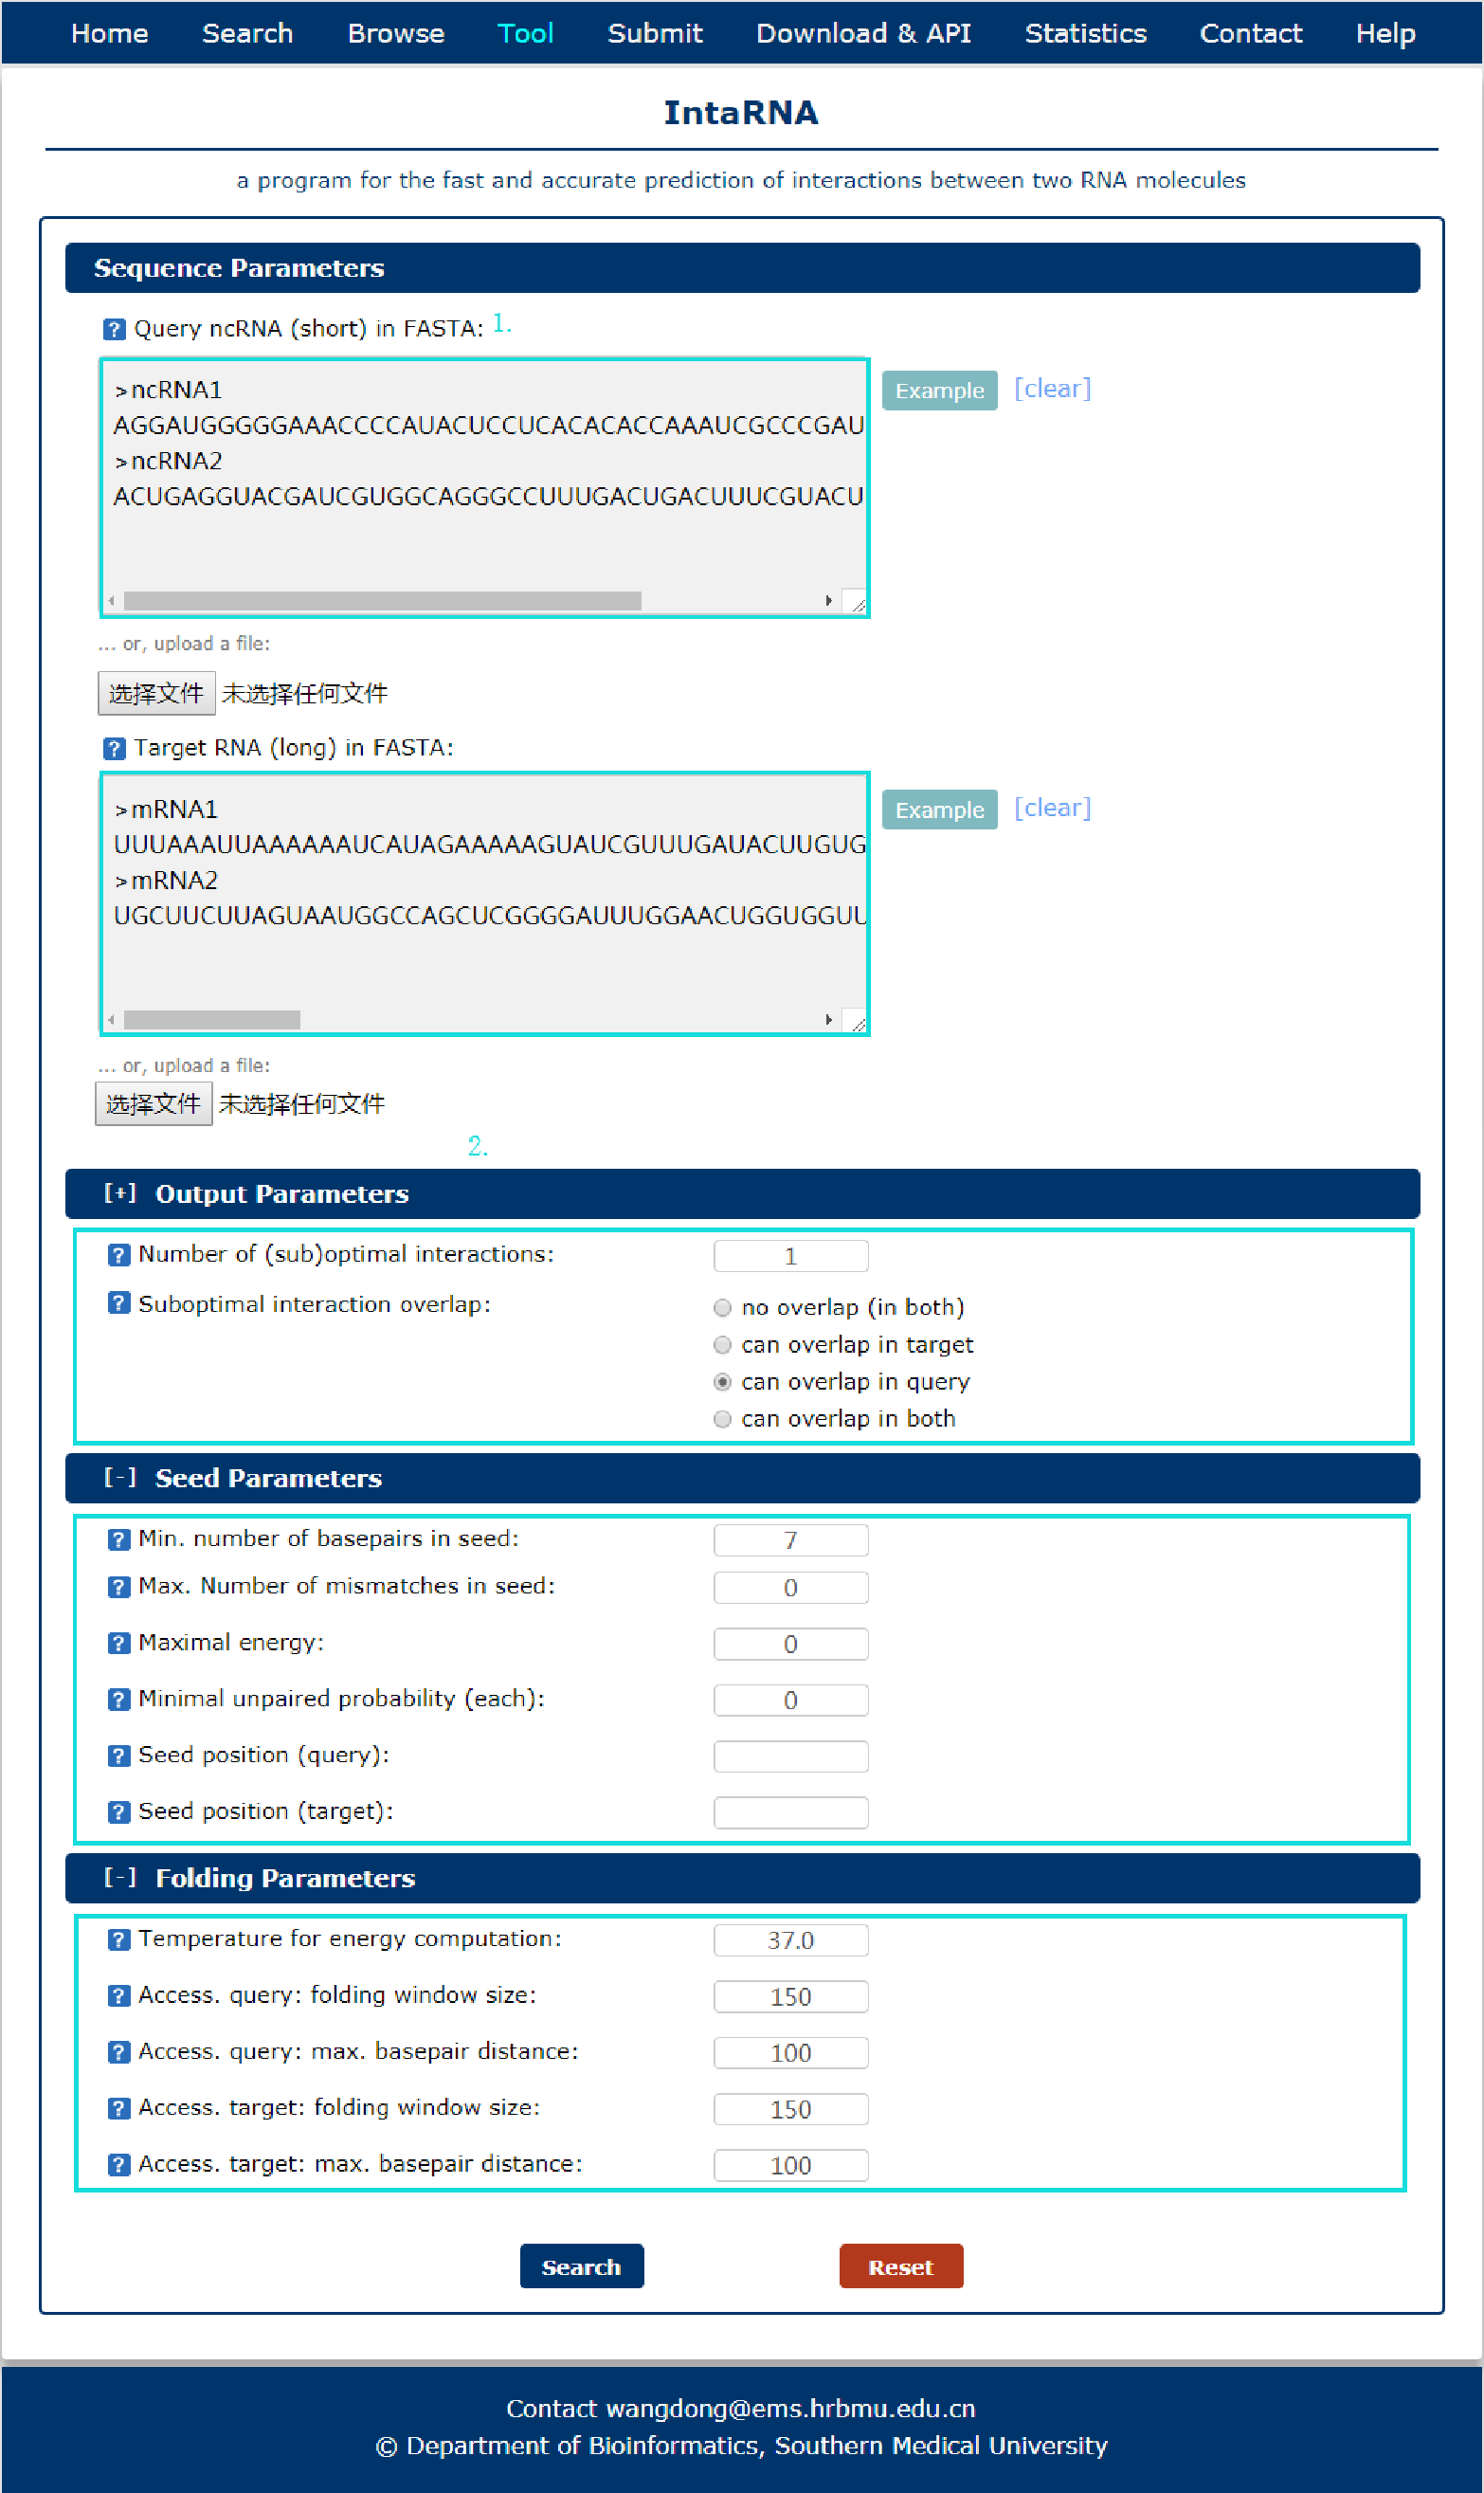
Fig 8-1 Tool of IntaRNA
Fig 8-2:
The search results include target, query, position and energy.
1. The results can be download.
2. Click each result (filling with yellow) can see the interaction position in detail.
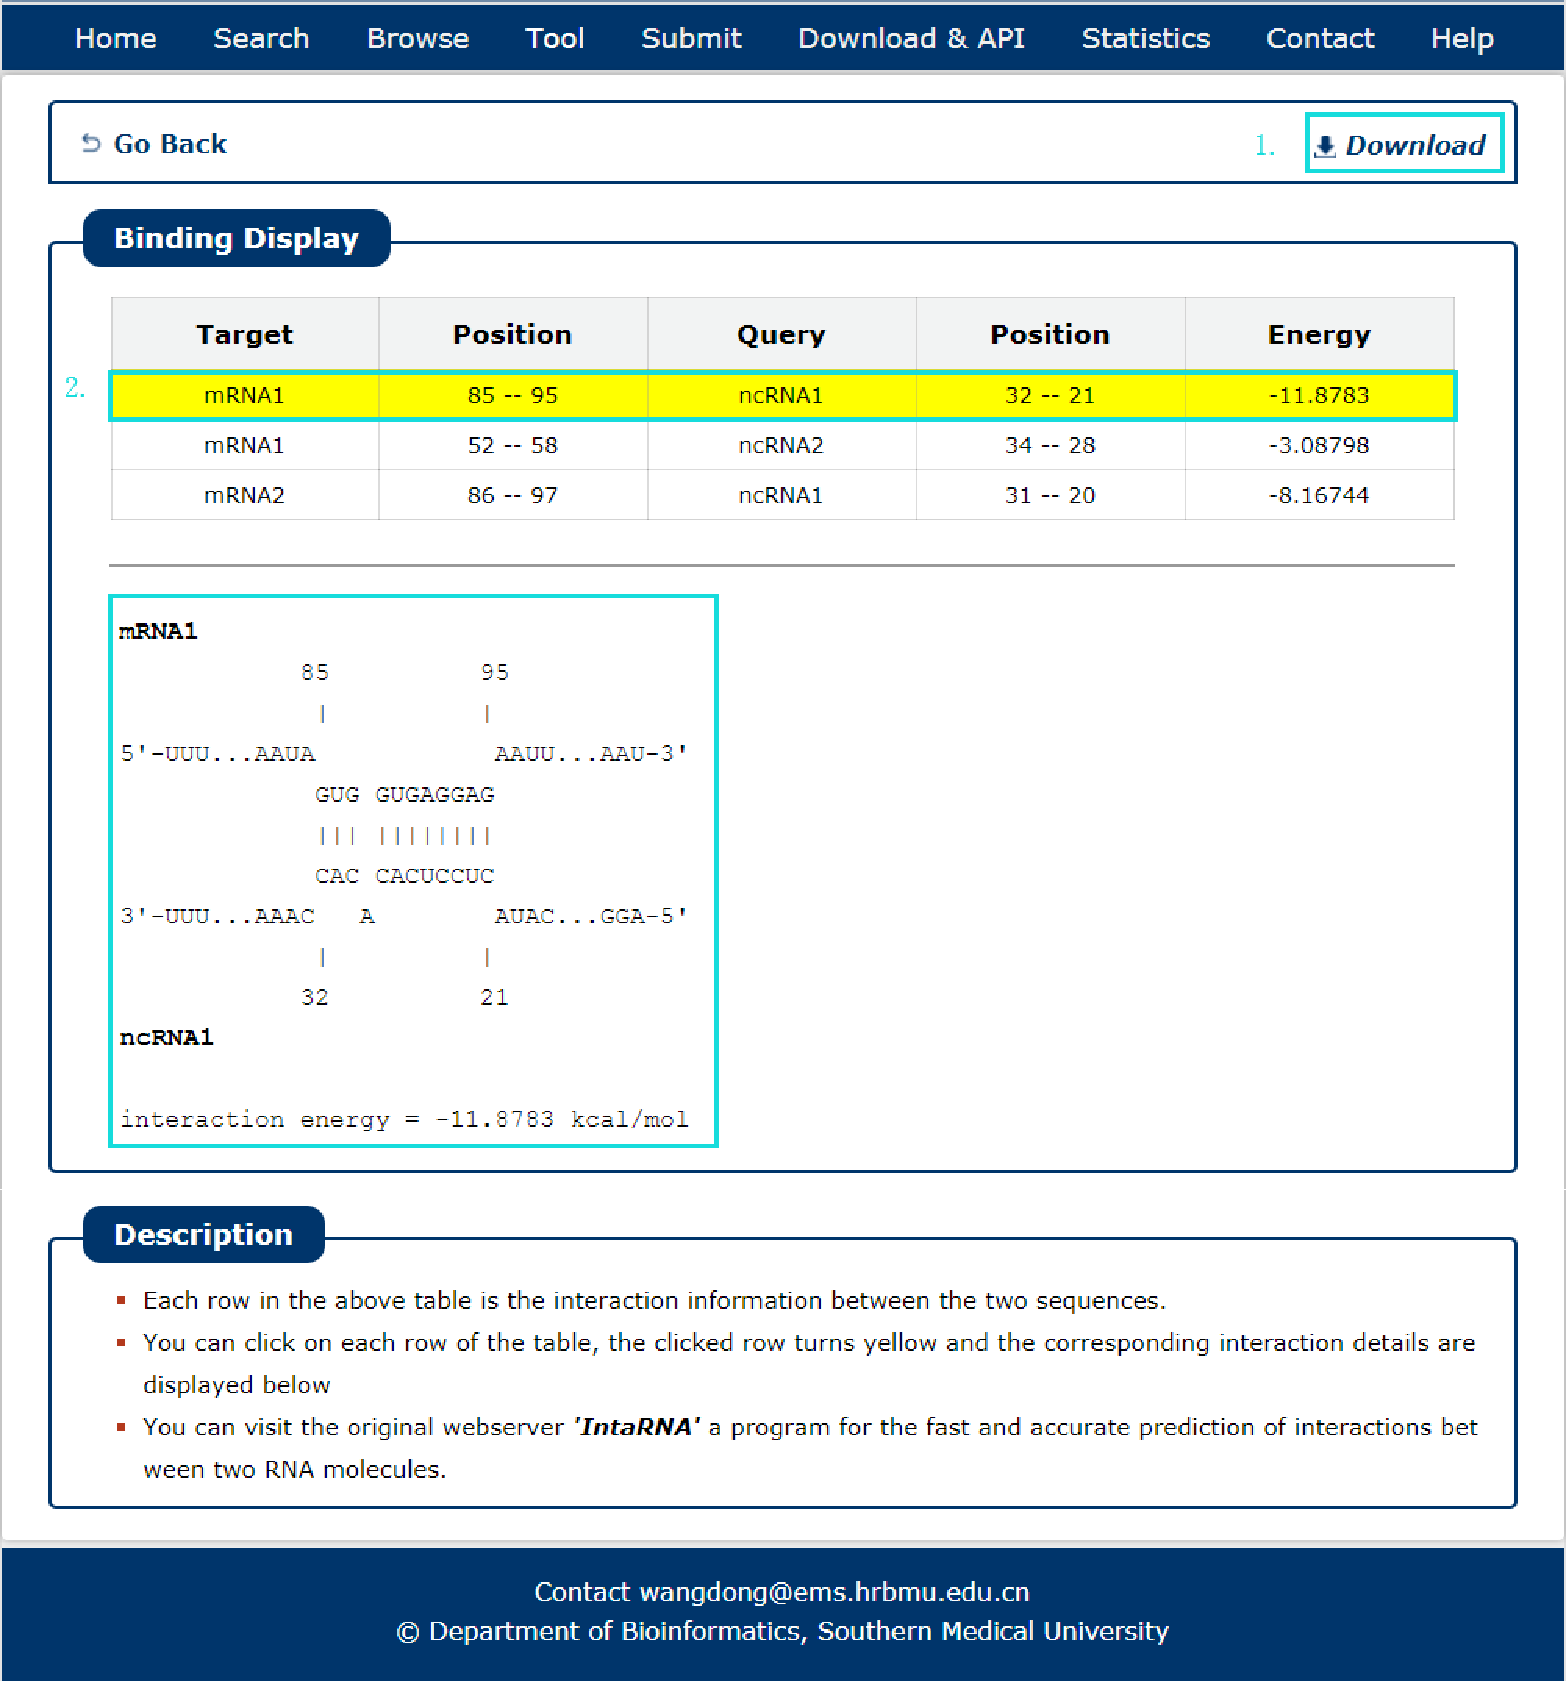
Fig 8-2 Result of IntaRNA
Fig 9-1:
A tool for Protein-RNA interaction predict is provided.
1. Input RNA and(or) protein sequence(s).
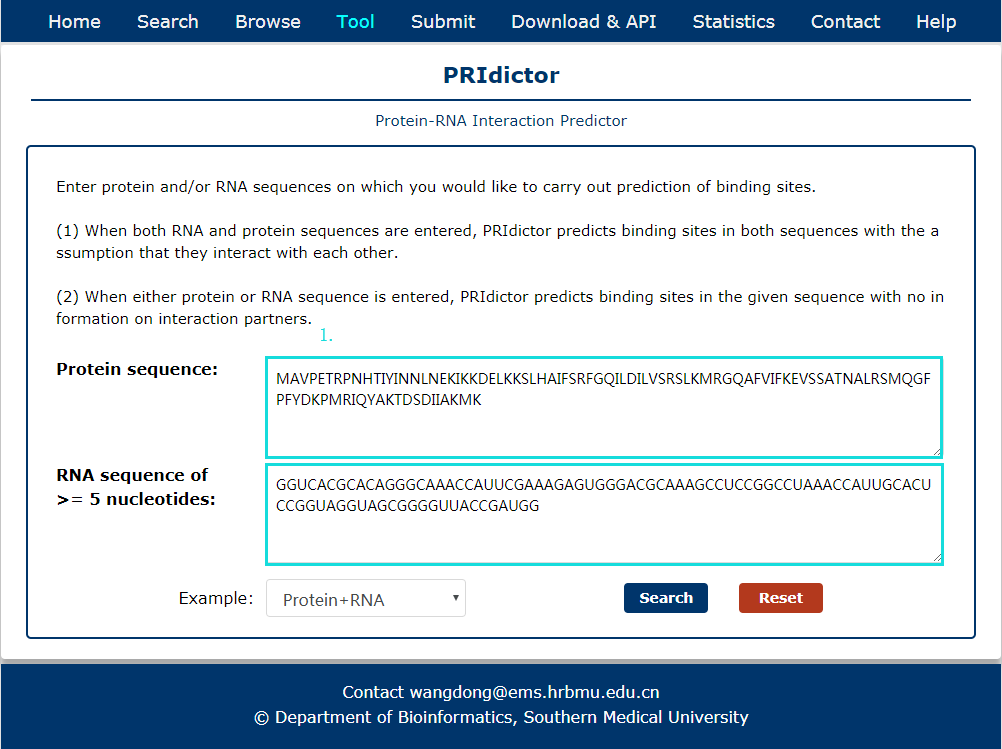
Fig 9-1 Tool of PRIdictor
Fig 9-2:
The search results include sequence, confidence and prediction sites.
1. The results can be download.
2. Every site correspond a score, click column can see in histogram.
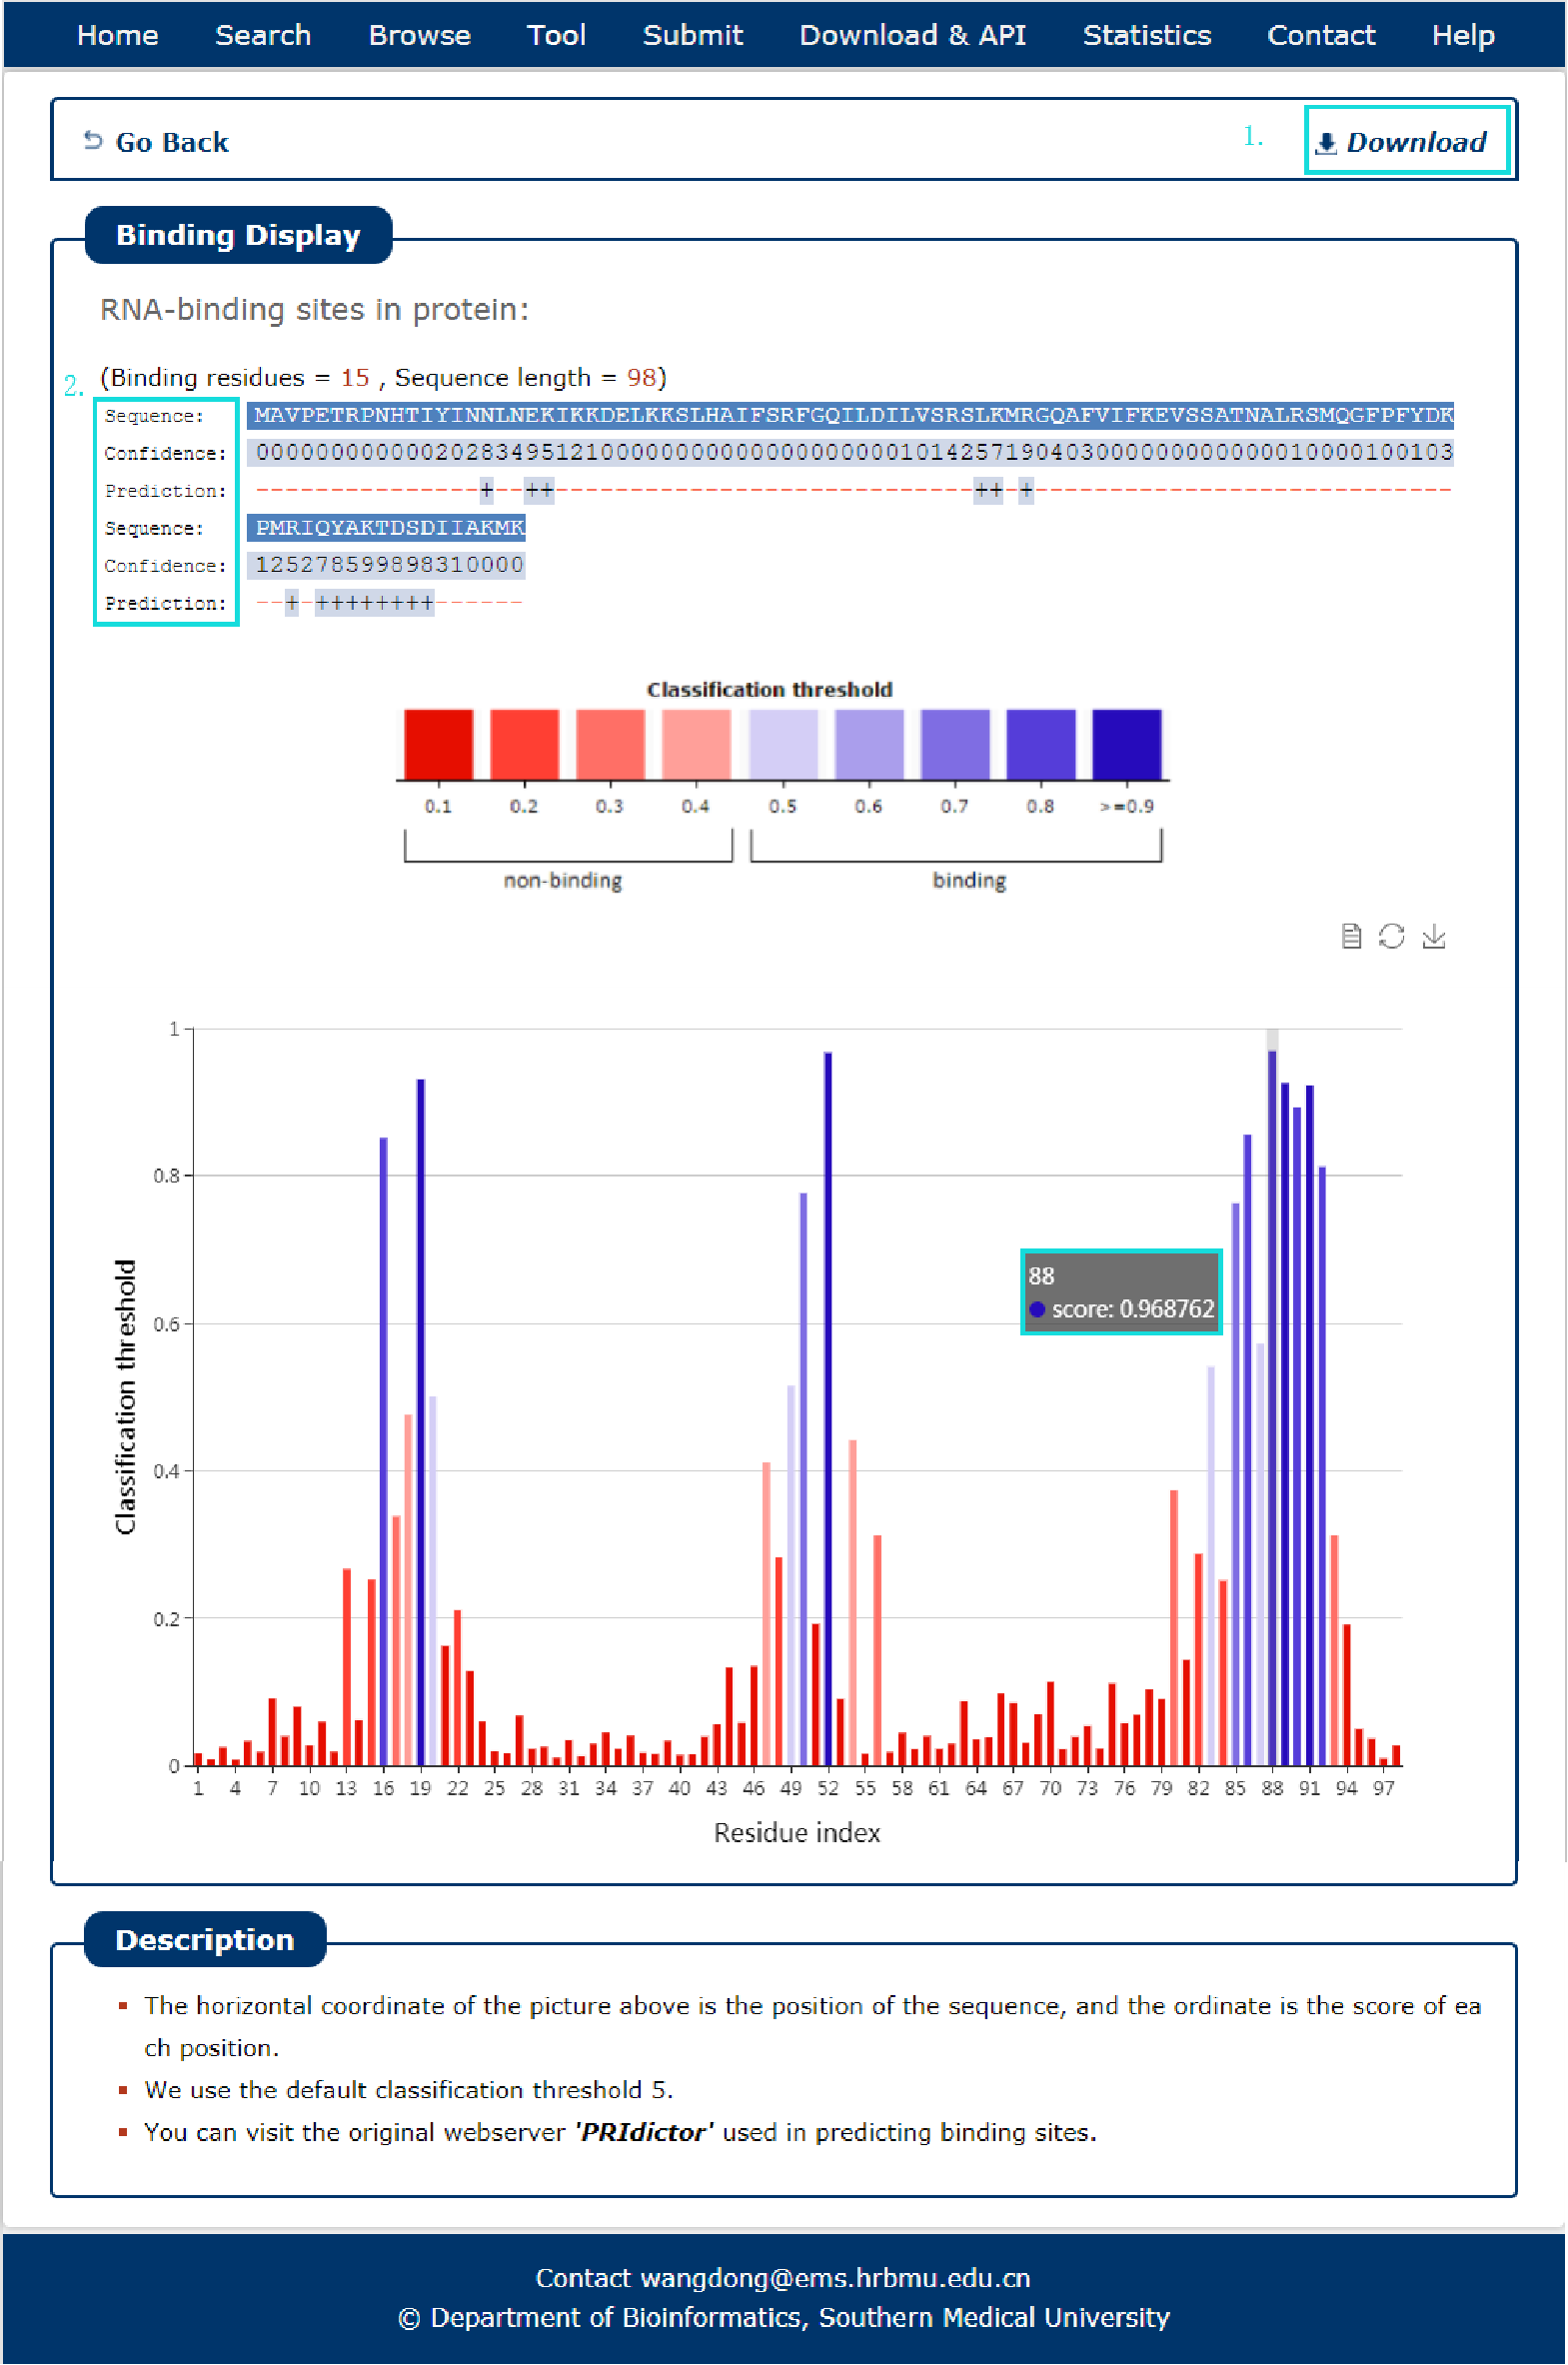
Fig 9-2 Result of PRIdictor
Fig 10-1:
A tool for predicting the sequence specificities of DNA- and RNA-binding proteins by deep learning is provided.
1. Input target sequence(s) or upload a file with FASTA format, and select query protein in left box.
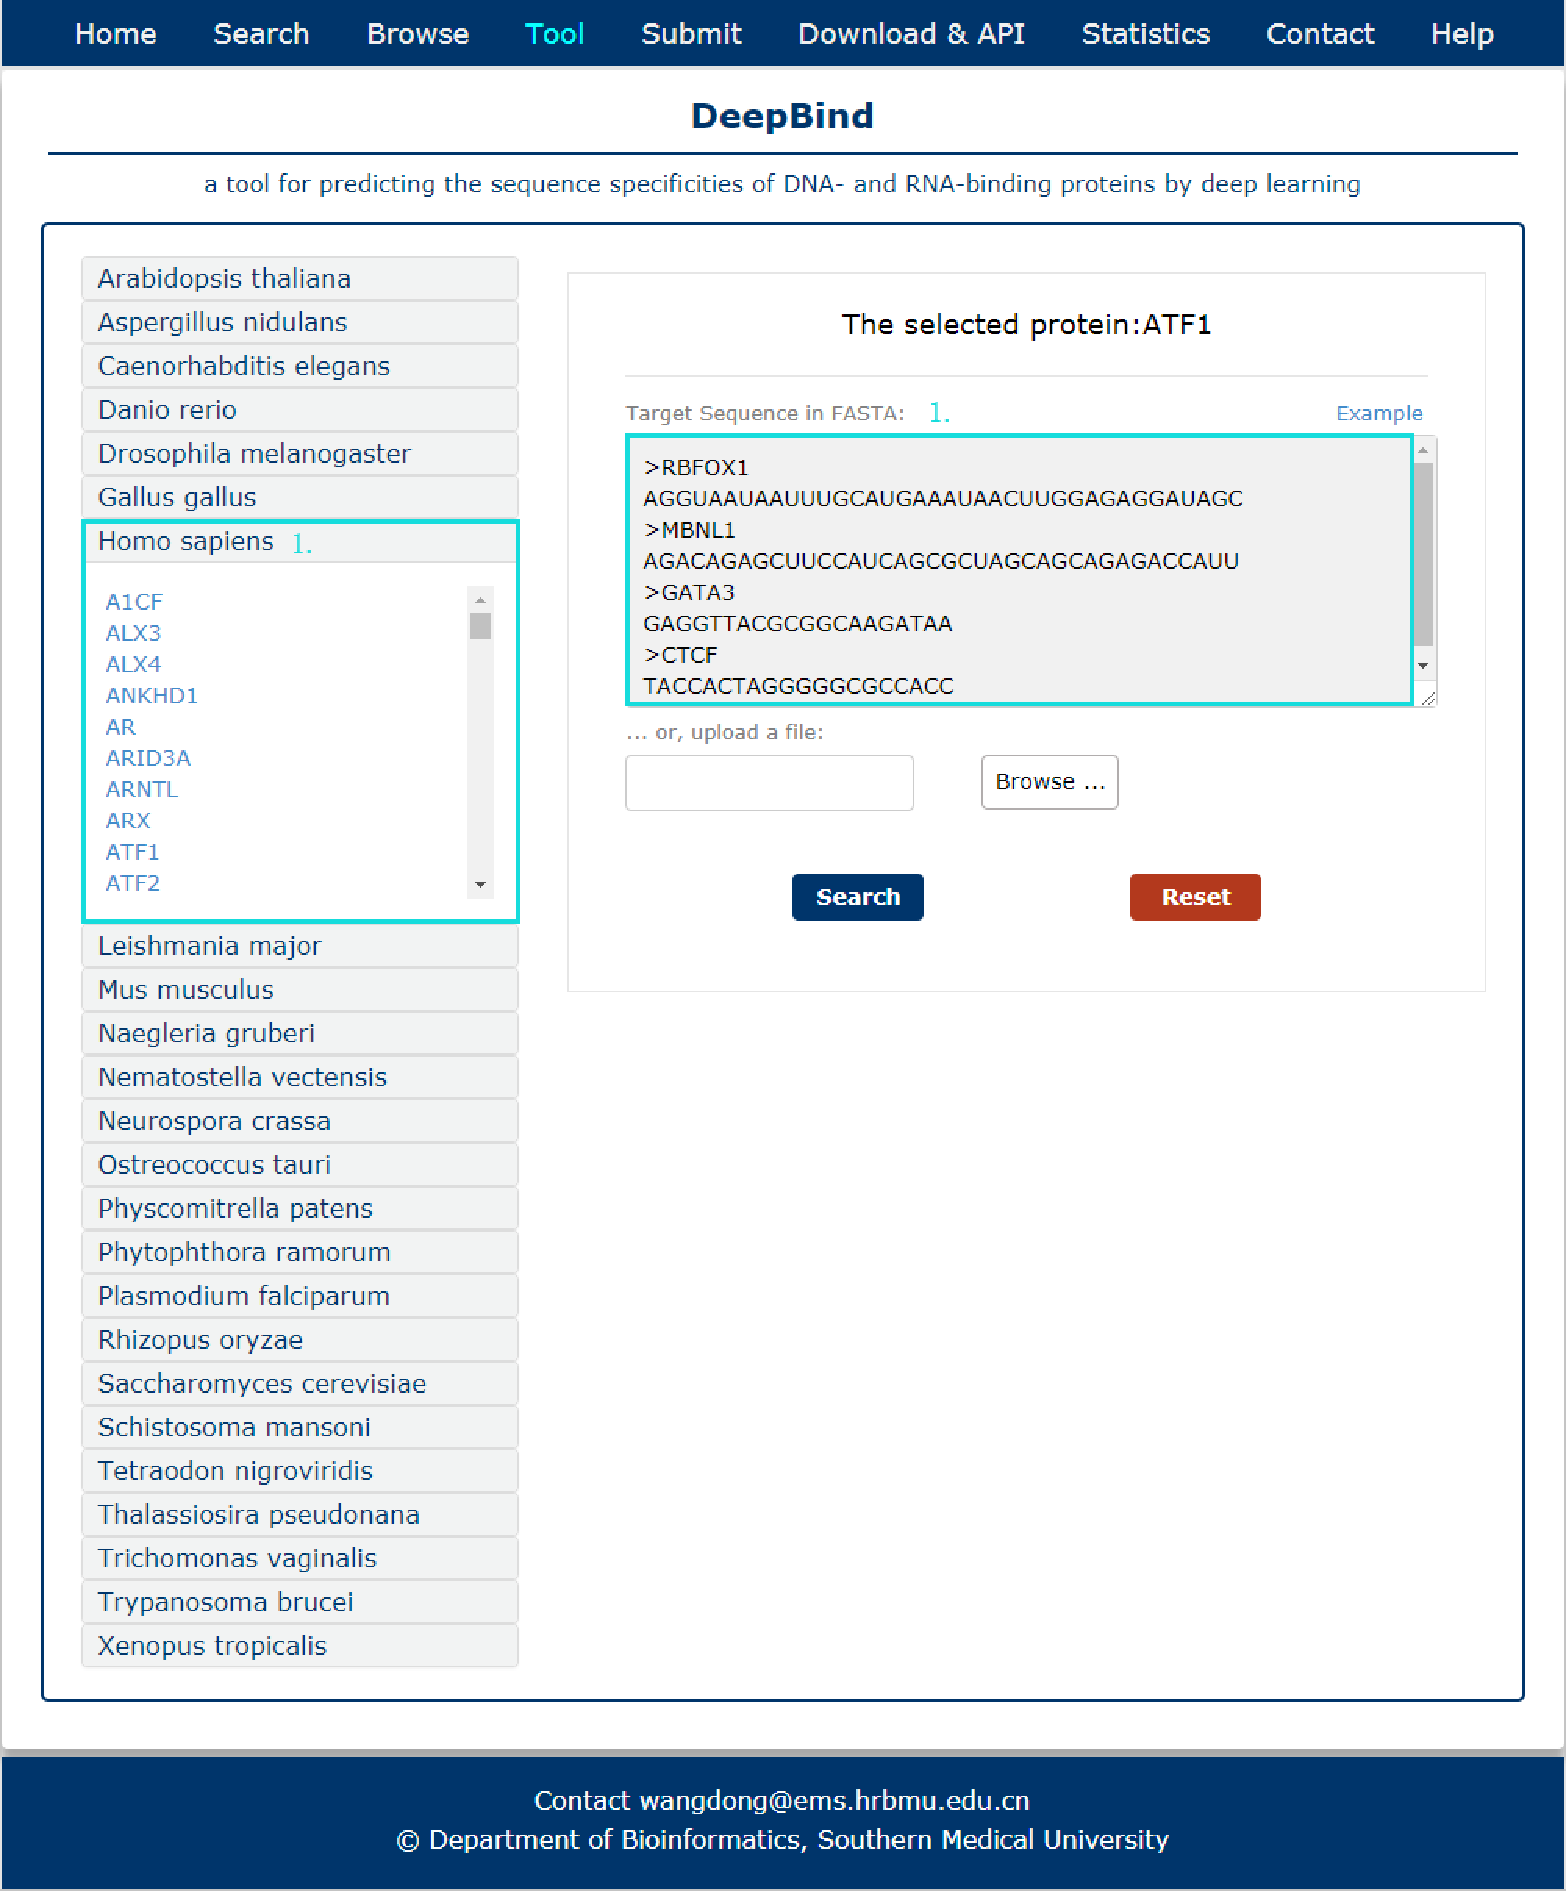
Fig 10-1 Tool of DeepBind
Fig 10-2:
The search results include target symbol, protein and its predict score, the results can be download.
1. The results can be download.
2. Result with score of target sequences and query protein.
3. Detail information of query protein from DeepBind databse.
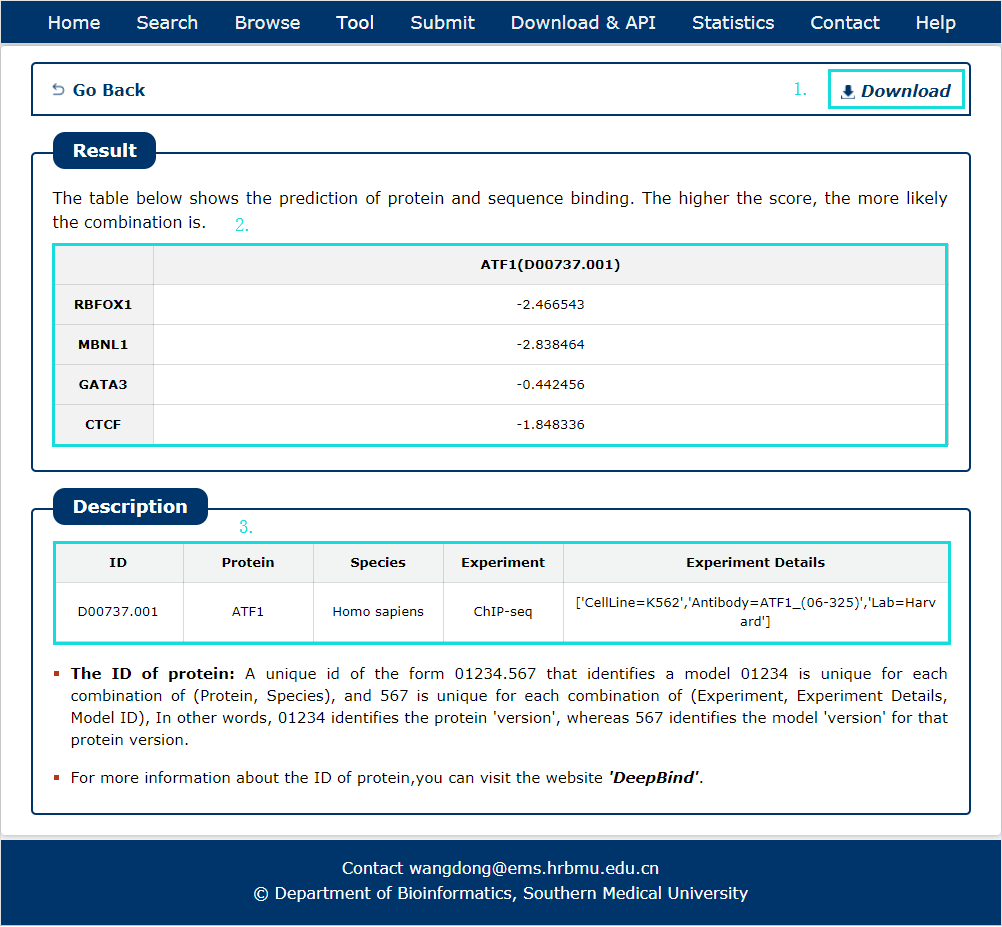
Fig 10-2 Result of DeepBind
- In RNAInter, the RNA-associated interactions are collected from different types of resources under one common framework, including experimental and computational prediction evidence. In principle, we assume that:
- (i) experimental evidence contributes more significantly to the confidence score than does evidence derived from computational prediction algorithms;
- (ii) strong experimental evidence with lower false positive rates are considered to provide more reliable evidence than weak experimental evidence;
- (iii) RNA-associated interactions supported by more evidence resources should be given higher confidence scores than those supported by fewer evidence resources.
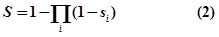
Therefore, we firstly assign quantitative confidence scores (strong experimental evidence: ss, weak experimental evidence: sw, computational prediction evidence: sp) to each RNA-associated interaction based on the evidence types and number of evidence resources as follows:
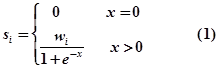
- where i is the evidence type (ss: strong experimental evidence, sw: weak experimental evidence, sp: computational prediction database) and x is the number of evidence resources, we set weight factor ws, ww and wp to 1, 0.7 and 0.2, respectively.Finally, an integrative confidence score (S) is calculated as:
| Abbreviation | Full name |
|---|---|
| ac4C | N4-acetylcytidine |
| acp3U | 3-(3-amino-3-carboxypropyl)uridine |
| Am | 2′-O-methylguanosine |
| Ar(p) | 2′-O-ribosyladenosine (phosphate) |
| Cm | 2′-O-methylcytidine |
| cmnm5s2U | 5-carboxymethylaminomethyl-2-thiouridine |
| cmnm5U | 5-carboxymethylaminomethyluridine |
| D | dihydrouridine |
| f5C | 5-formylcytidine |
| galQtRNA | galactosyl-queuosine |
| Gm | 2′-O-methylguanosine |
| I | inosine |
| i6A | N6-isopentenyladenosine |
| m1A | 1-methyladenosine |
| m1G | 1-methylguanosine |
| m1I | 1-methylinosine |
| m1Y | 1-methylpseudouridine |
| m2,2G | N2,N2-dimethylguanosine |
| m2G | N2-methylguanosine |
| m3C | 3-methylcytidine |
| m3U | 3-methyluridine |
| m5C | 5-methylcytidine |
| m5C | 5-methylcytidine |
| m5U | 5-methyluridine |
| m5Um | 5,2′-O-dimethyluridine |
| m5Um | 5,2′-O-dimethyluridine |
| m62A | N6,N6-dimethyladenosine |
| m6A | N6-methyladenosine |
| m7G | 7-methylguanosine |
| mcm5s2U | 5-methoxycarbonylmethyl-2-thiouridine |
| mcm5U | 5-methoxycarbonylmethyluridine |
| ncm5U | 5-carbamoylmethyluridine |
| o2yW | peroxywybutosine |
| QtRNA | queuosine |
| t6A | N6-threonylcarbamoyladenosine |
| Tm | 2′-O-methylguanosine |
| tm5s2U | 5-taurinomethyl-2-thiouridine |
| tm5U | 5-taurinomethyluridine |
| Um | 2′-O-methylguanosine |
| xA | unknown modified adenosine |
| xG | unknown modified guanosine |
| xU | unknown modified uridine |
| Y | pseudouridine |
| Ym | 2′-O-methylpseudouridine |
| yW | wybutosine |
Integration of source databases which use different interactors naming conventions is challenging. To ensure maximal connectivity of data, we transform each interactor name found in the input sources to the appropriate naming convention.
1. For miRNA, we use miRBase ID and miRBase Accession.
2. For compound, we use NCBI PubChem Compound symbol and CID.
3. For histone modification, we use ChIPBase symbol.
4. For others, we use official Gene Symbol, Entrez ID and Ensembl GID.
5. For species, we normalized organism names according to NCBI Taxonomy Database.