Overview:
Cellinker documents over 3,700 human and 3,200 mouse L-R interactions and embeds a practical and convenient webserver with which researchers can decode intercellular communications based on scRNA-seq data. And over 400 small molecule (sMOL) related L-R interactions were collected as well. Moreover, to help with research on coronavirus (CoV) infection, Cellinker also collects information on over 16 L-R interactions involved in COV-human interactions (including 12 L-R interactions involved in SARS-CoV-2 infection). In summary, Cellinker provides a user-friendly interface for querying, browsing and visualizing L-R interactions as well as a practical and convenient web tool for inferring intercellular communications based on scRNA-seq data.
The homepage is displayed in the following Fig 1-1.
1. Main functions of the platform are provided in menu bar form (boxed in red).
2. Introduction and overview for Cellinker.
3. Quick search for users.
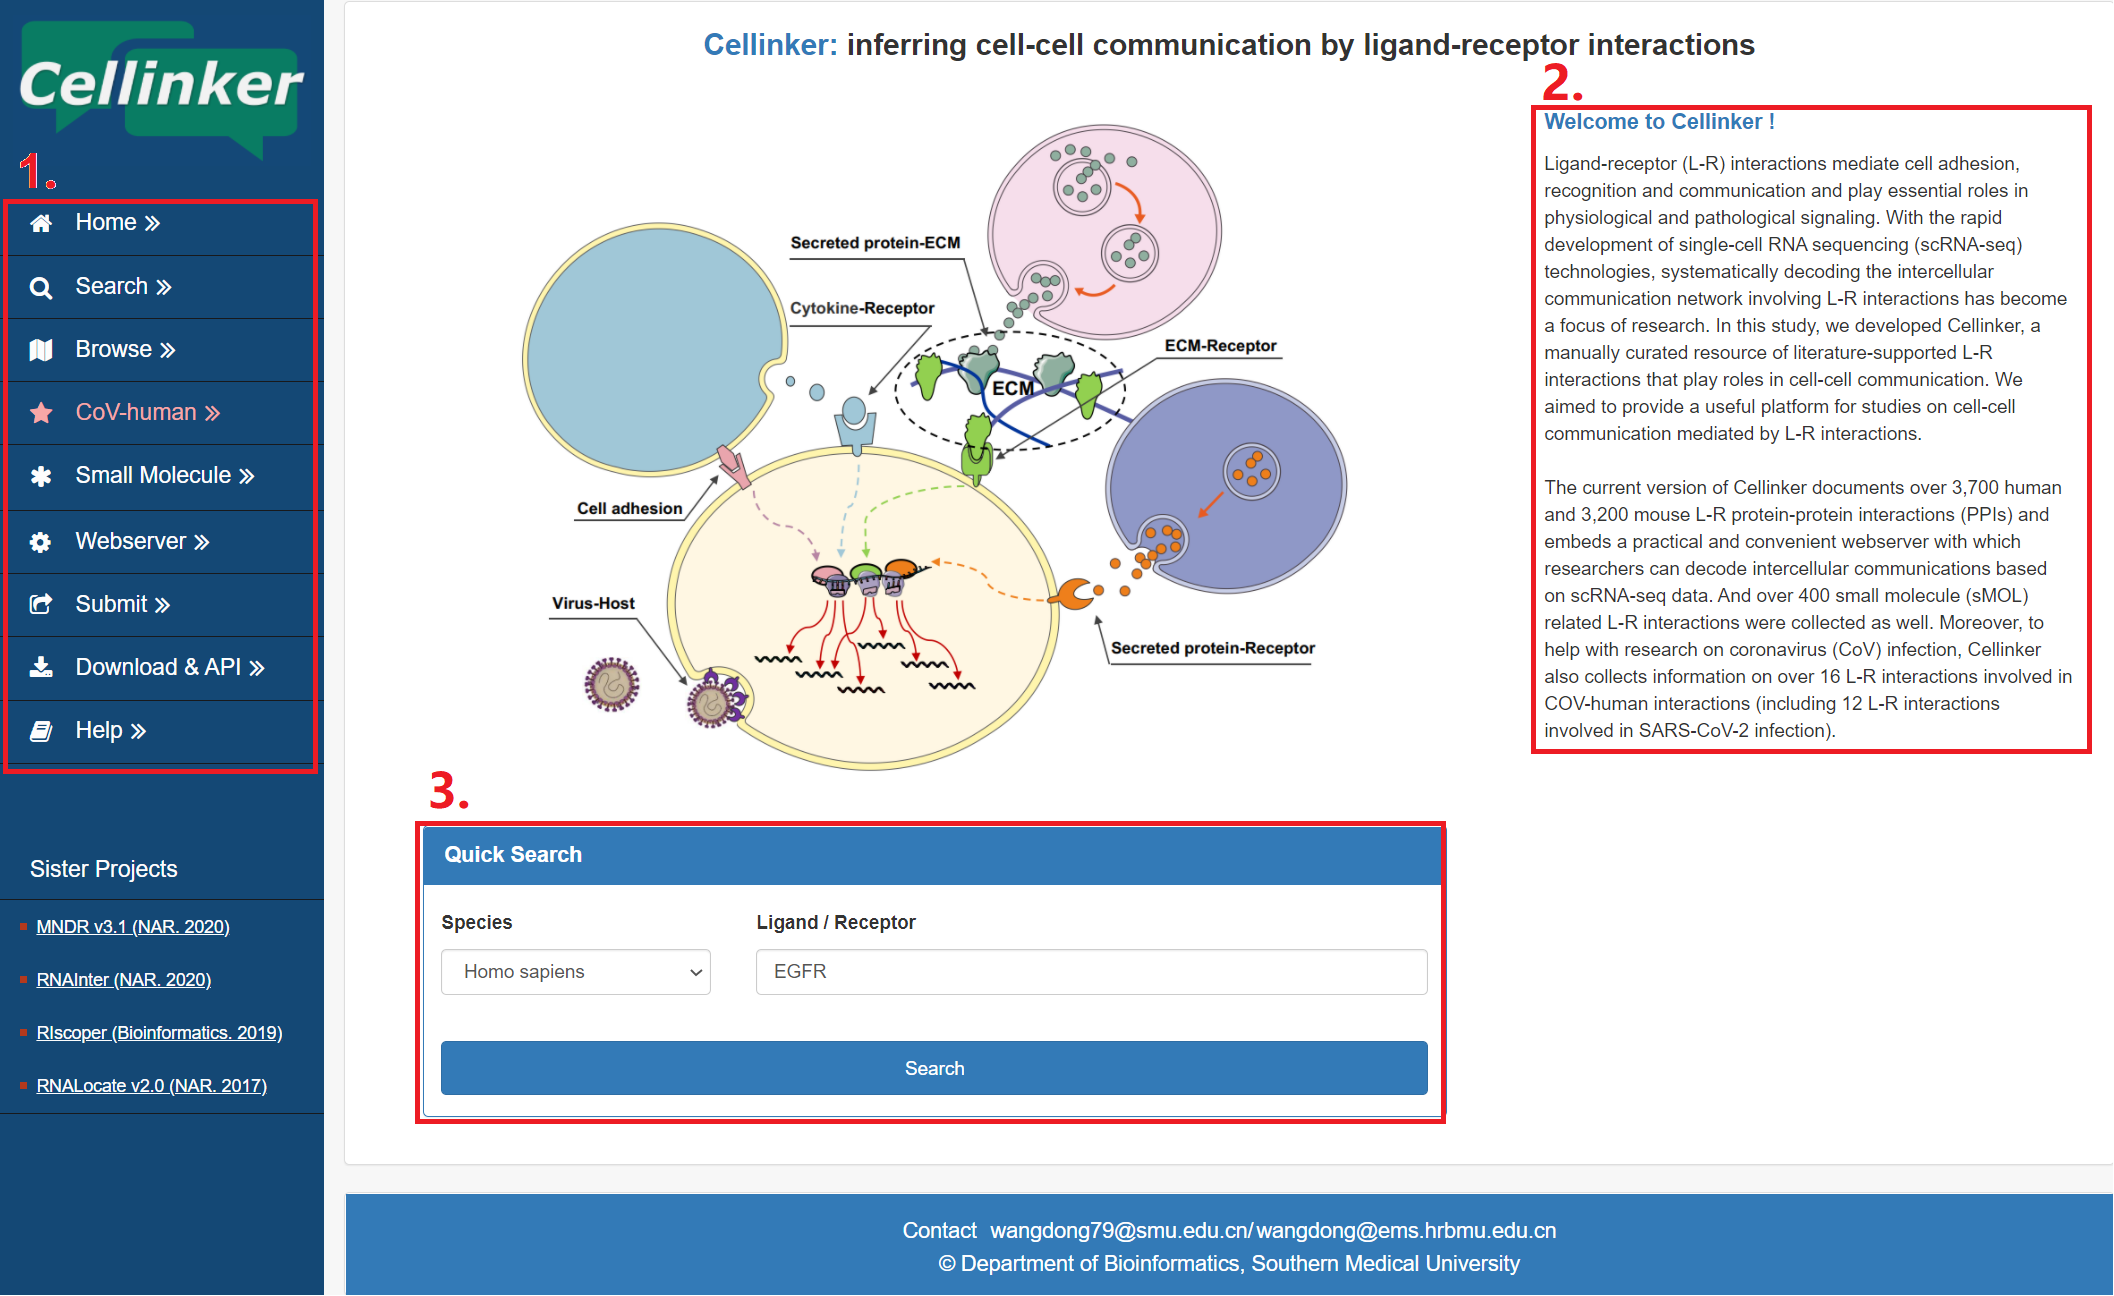
Fig 1-1 Homepage
The search page is displayed in Fig 2-1:
Exact search:
1. Carefully select a dataset: Three choices are provided (Gene Symbol/Entrez ID).
2. Input a keyword corresponding to selected dataset.
3. Two categories provided to filter results: Species and Interaction Type.
Batch search:
4. Input or upload Gene Symbol/Entrez ID list of ligands/receptors to query corresponding interesting interactions.
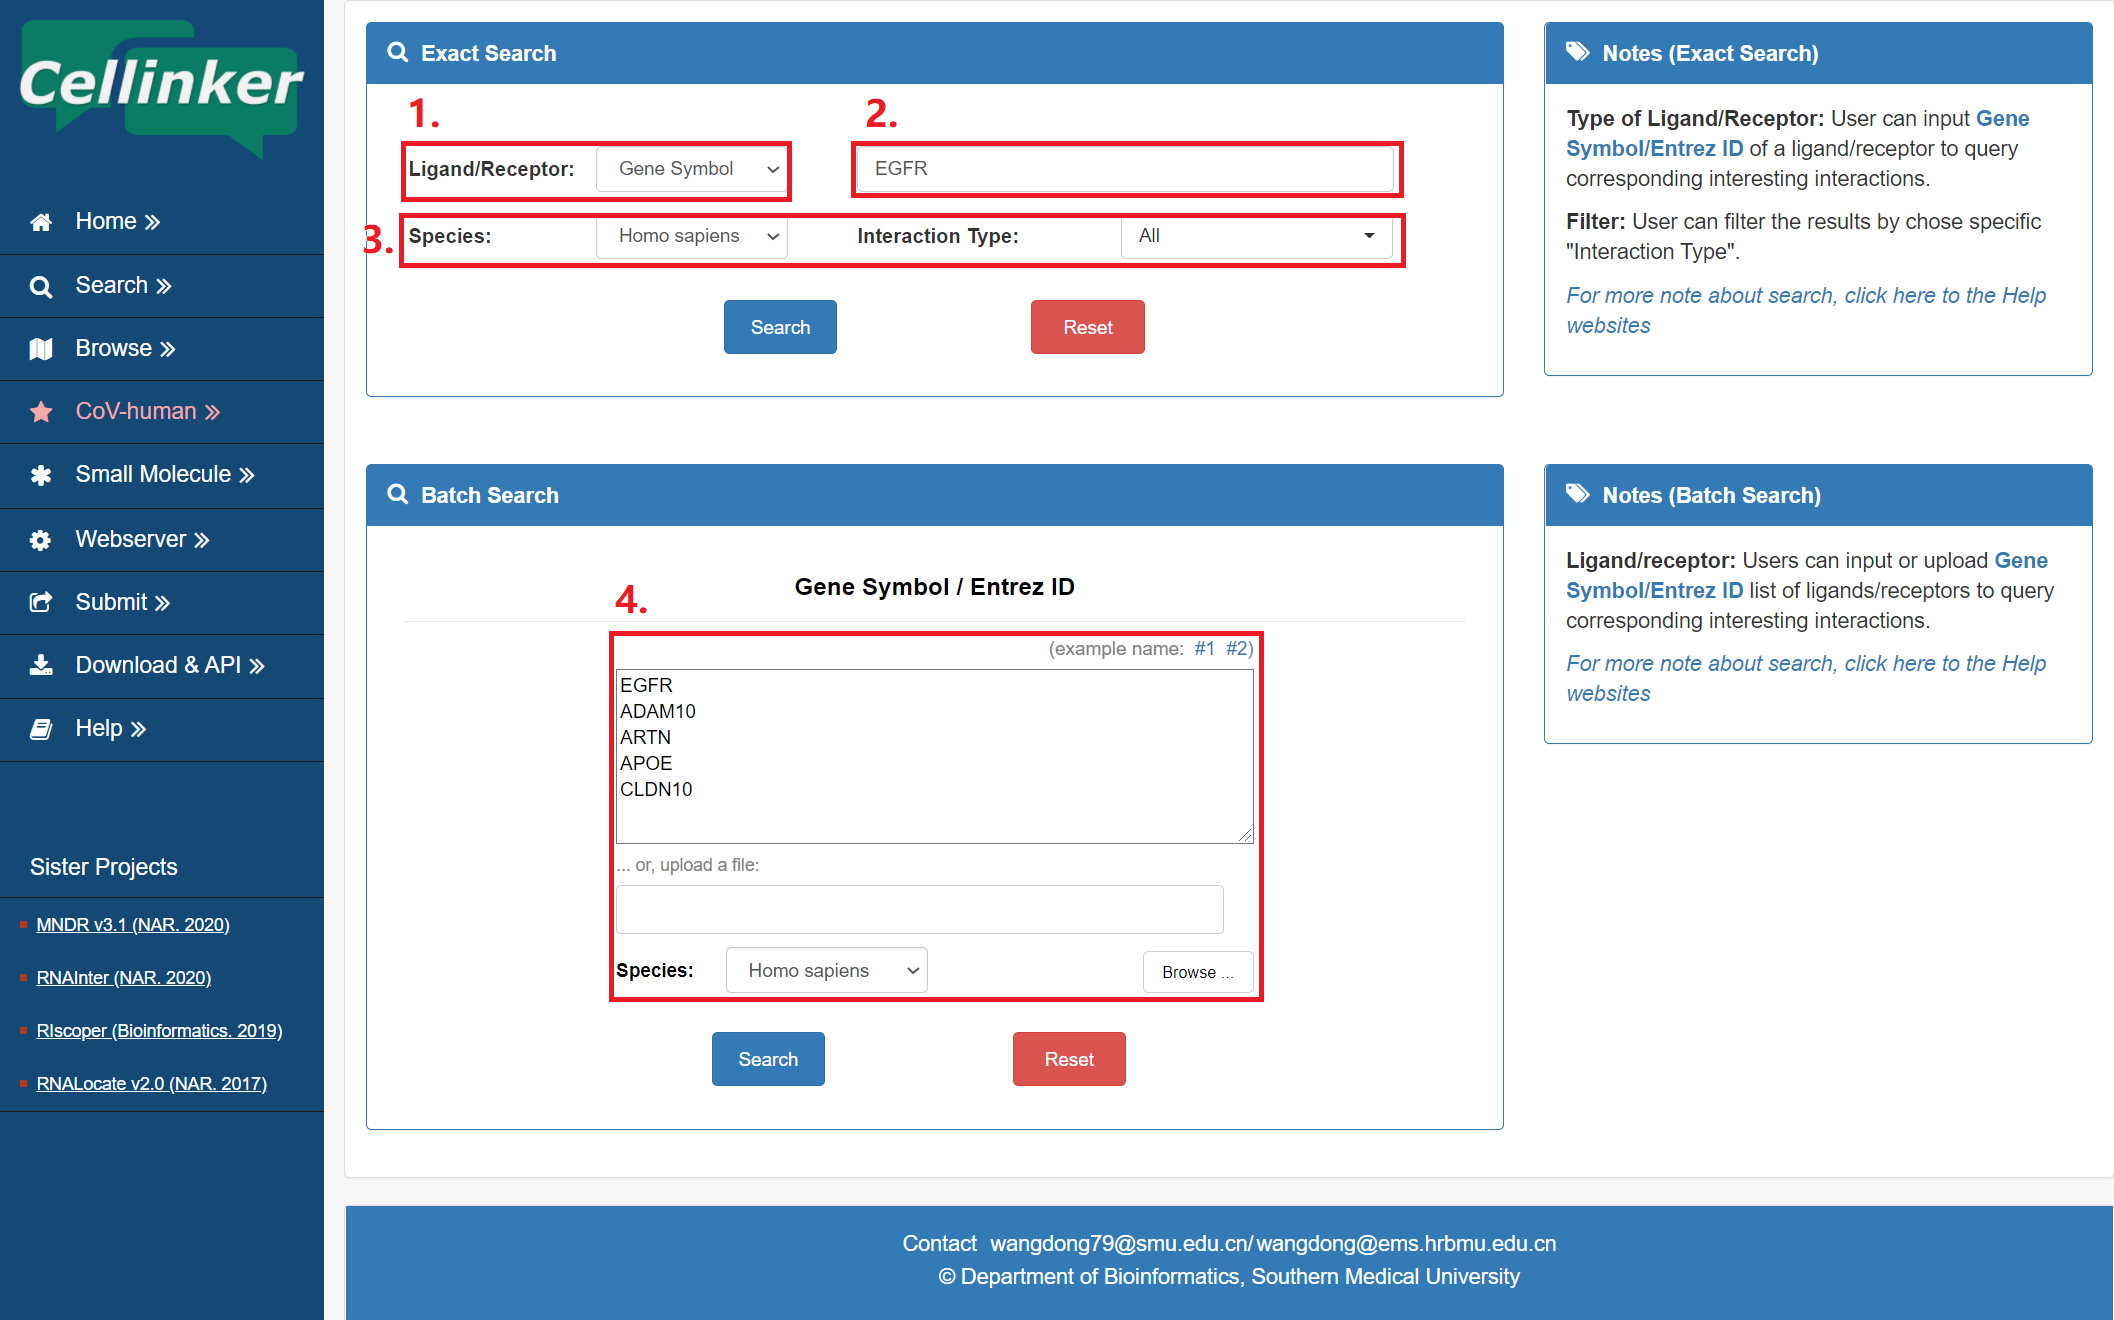
Fig 2-1. Search page
To help users view and interactively analyze ligand-receptor interactions, the result page provides a table and an embedded sankey diagram web tool.
Fig 3-1:
1. The table of the search results.
2. Total sum of results.
3. Download your search results.
4. Click to link to detail page.
5. Click to turn the page.
6. The subcellular location of ligand.
7. Ligand list.
8. Receptor list.
9. The subcellular location of receptor.
10. Download the sankey diagram.
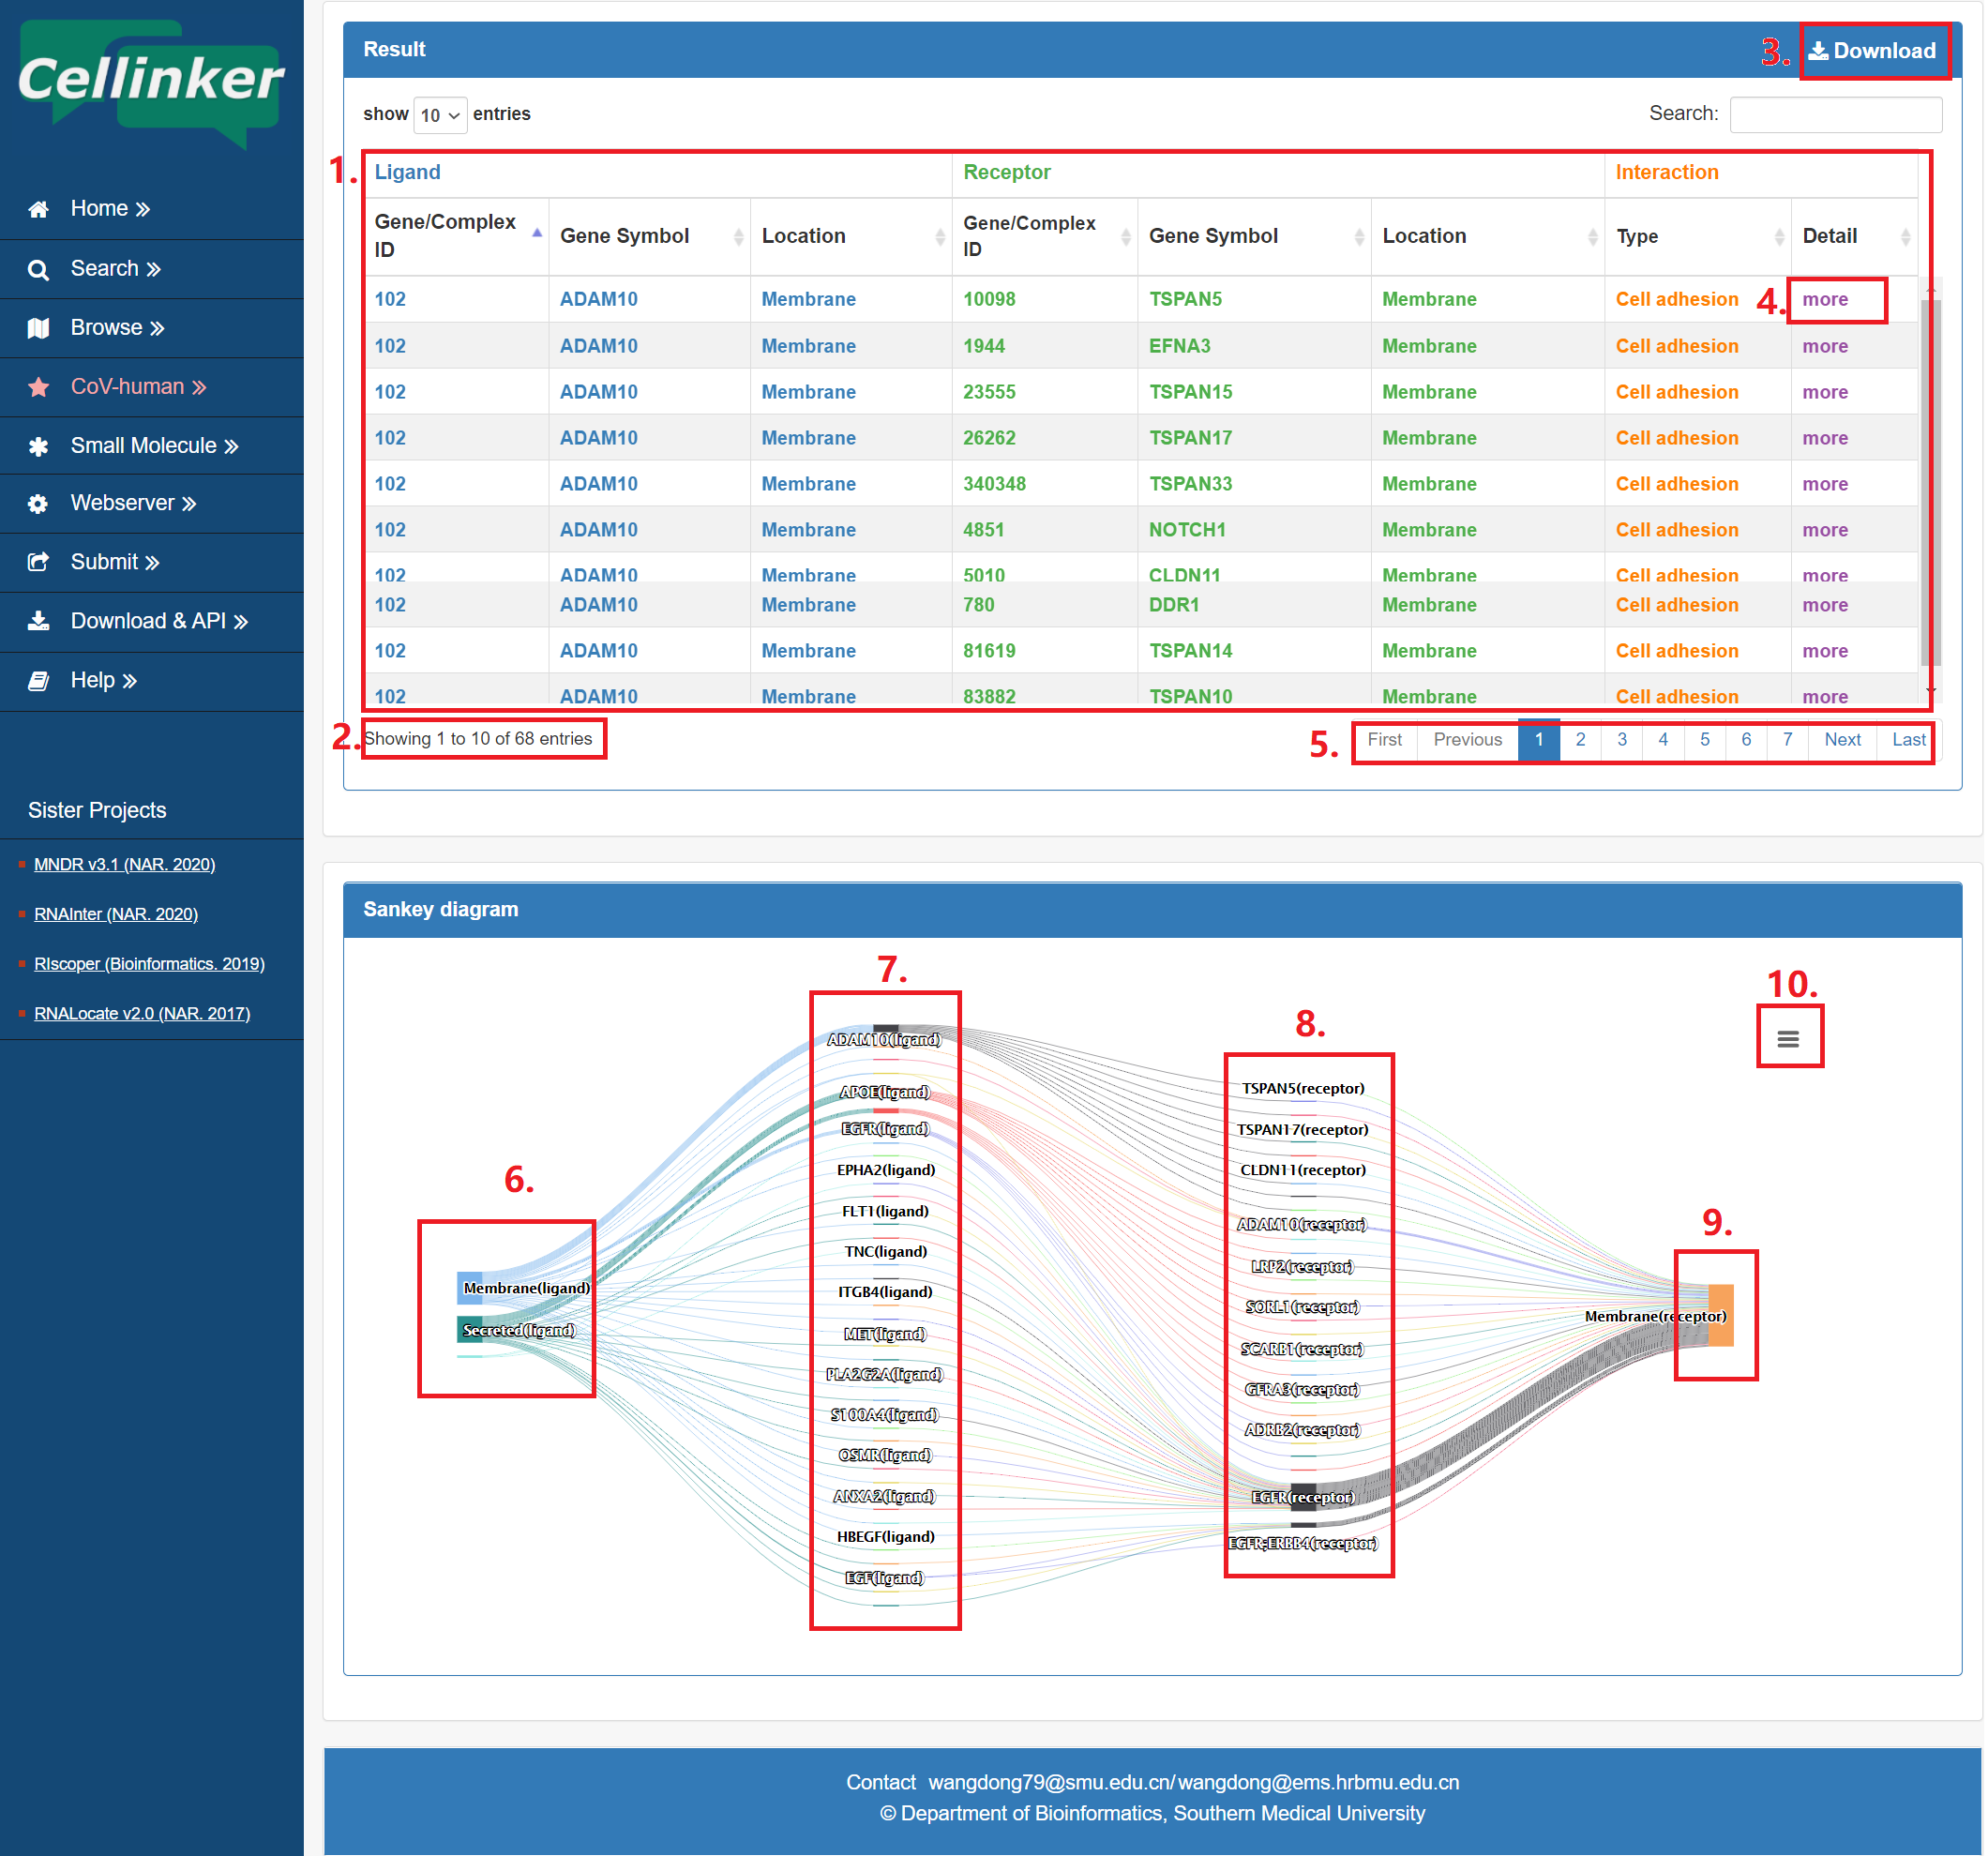
Fig 3-1. Search result page
In the detail page, you can get the detail information of the ligand-receptor interaction.
Fig 4-1:
1. Information of interaction: including interaction type, species, and related pathways etc.
2. Information of ligand/receptor: including symbols, Entrez gene ID and subcellular location etc.
3. The ligand/receptor complex information.
4. The expression of ligand/receptor across different tissues.
5. Source of the interaction (publications or database).
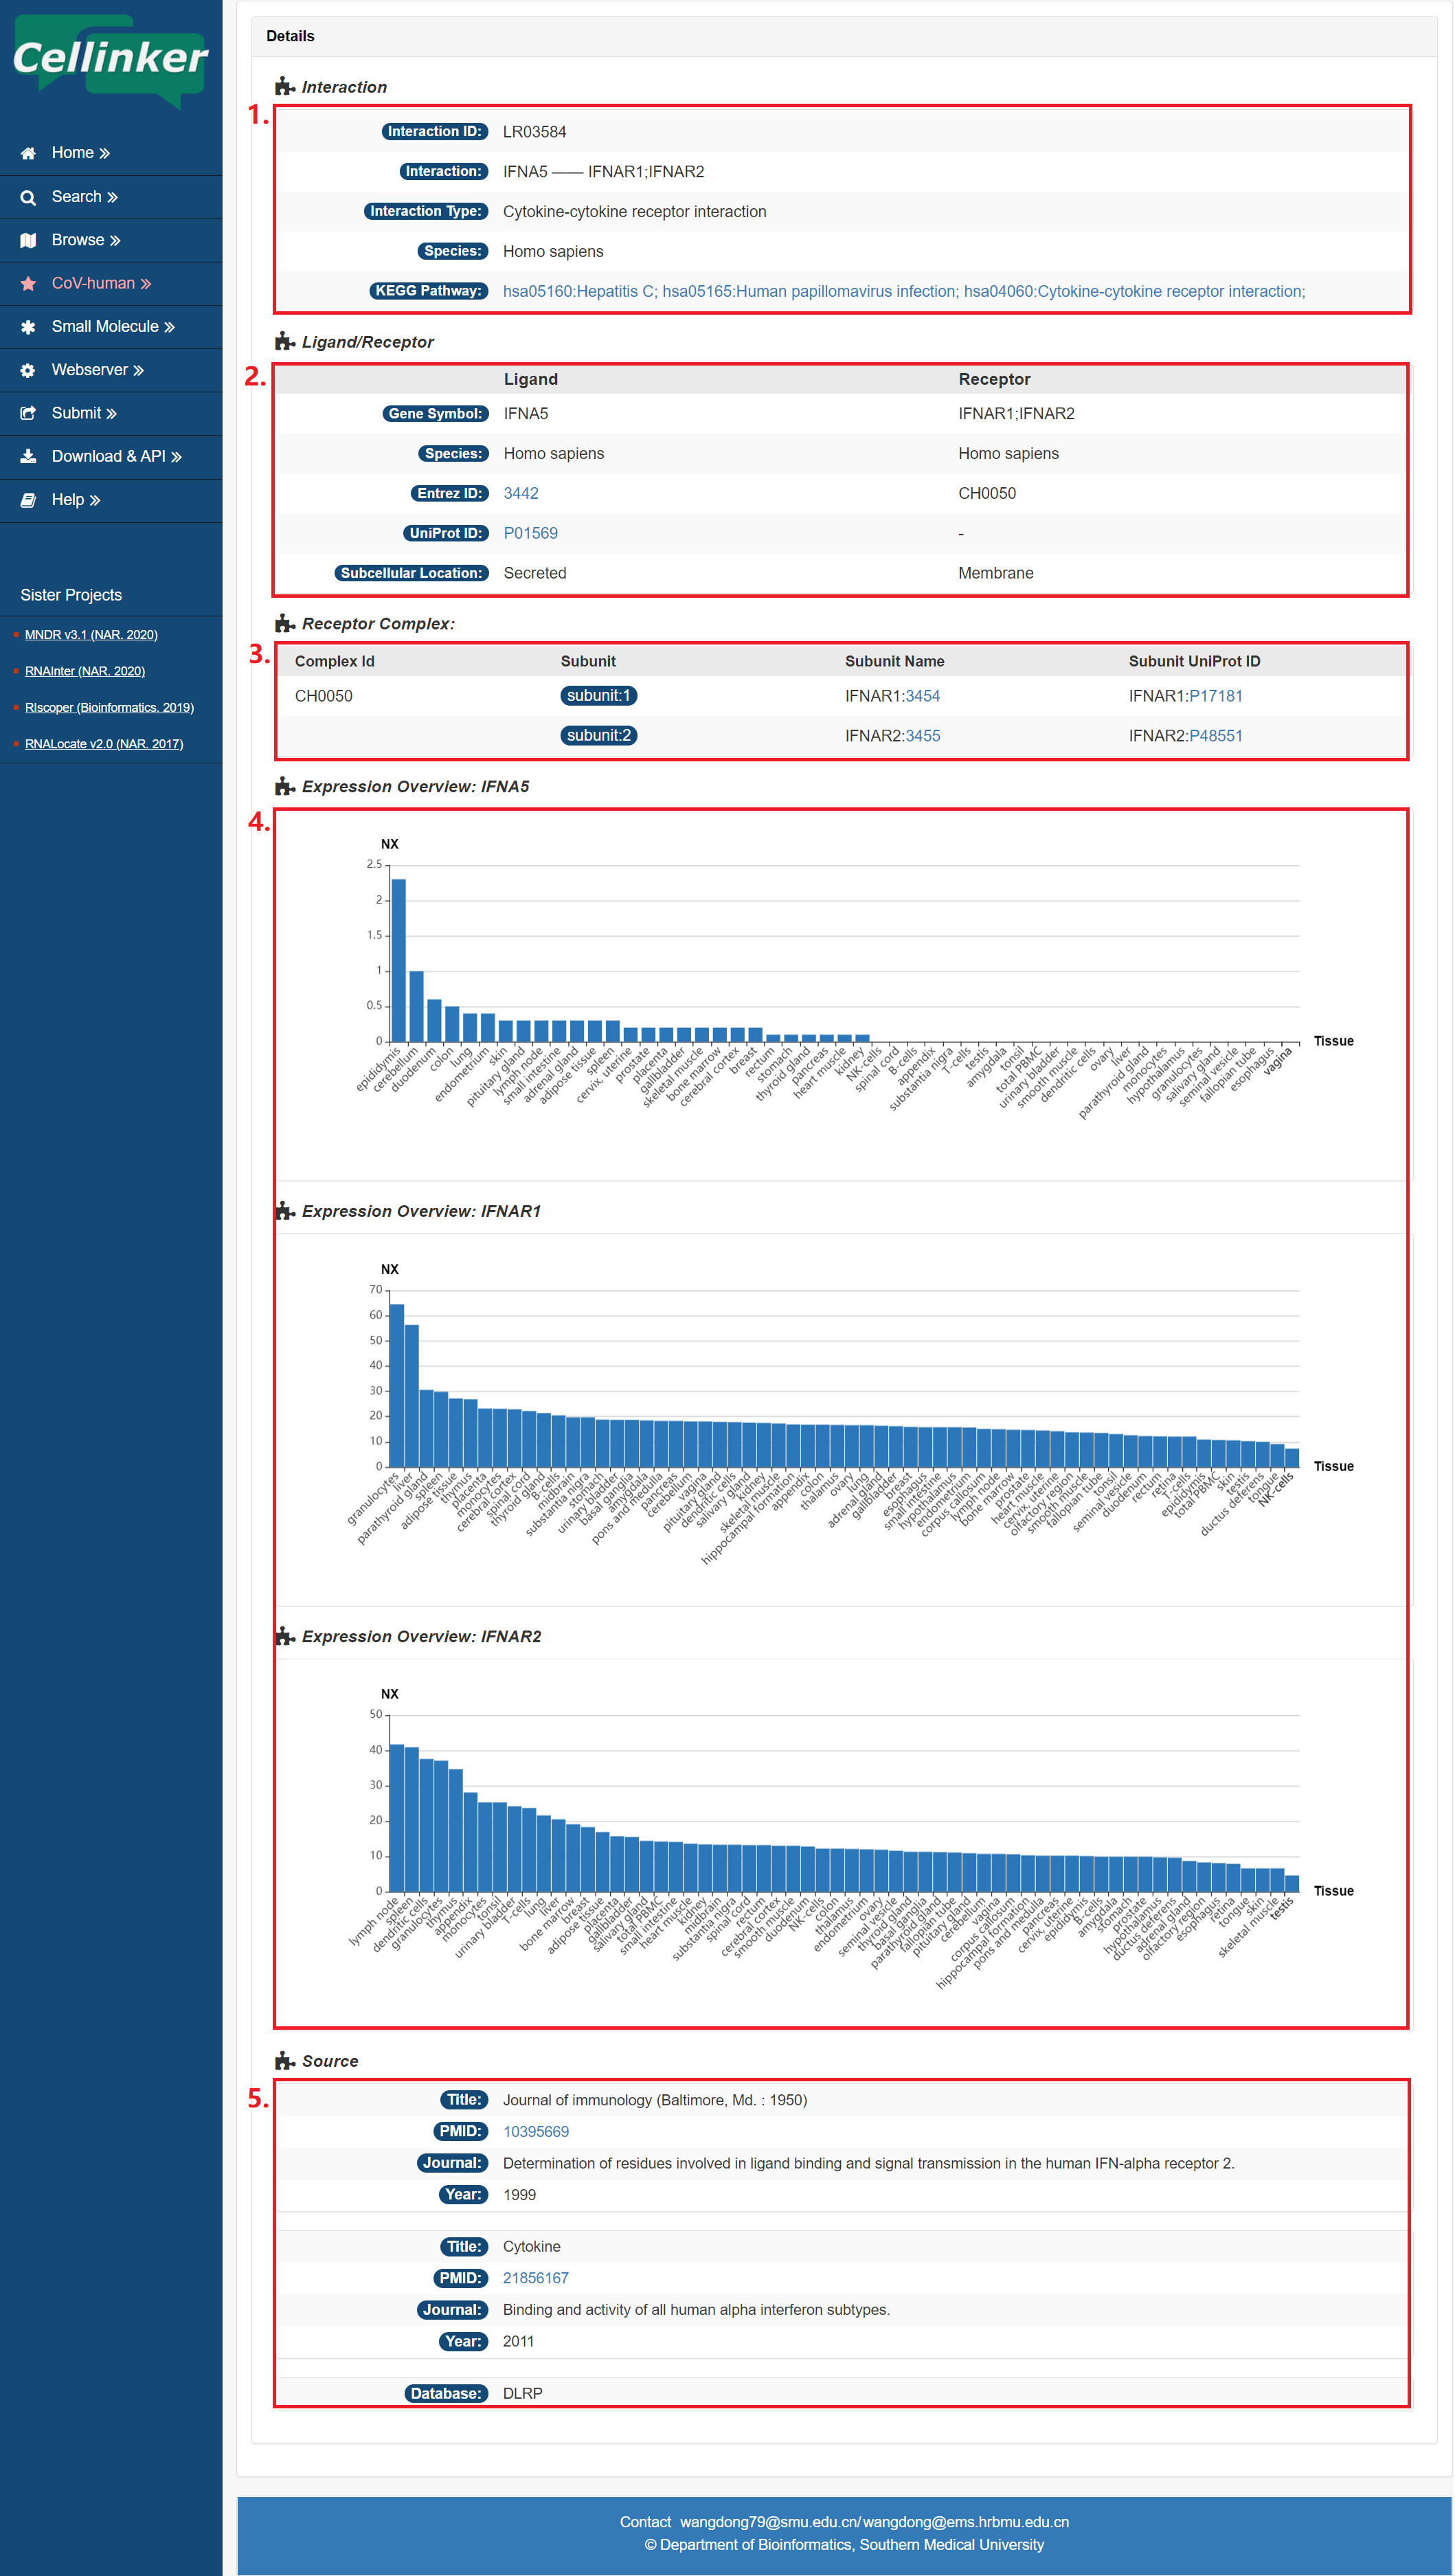
Fig 4-1. Detail page
Notes:
The human gene expression profiles across 62 tissues were collected from The Human Protein Atlas project (RNA consensus tissue gene data), and the mouse expression profiles across 39 tissues were collected from TISSUES 2.0 database (GeneChip data).
Cellinker divide all interactions into 5 interaction types by consideration common perspectives from multiple review articles, the known catalog from KEGG pathway database and the subcellular localization of the ligands/receptors. Users can browse the data by species and interaction types (by click on the correct icon in Figure 5-1). Moreover, the statistics information of Cellinker is also presented in browse page.
Fig 5-1:
1. Browse by species and interaction types.
2. Statistics information of Cellinker.
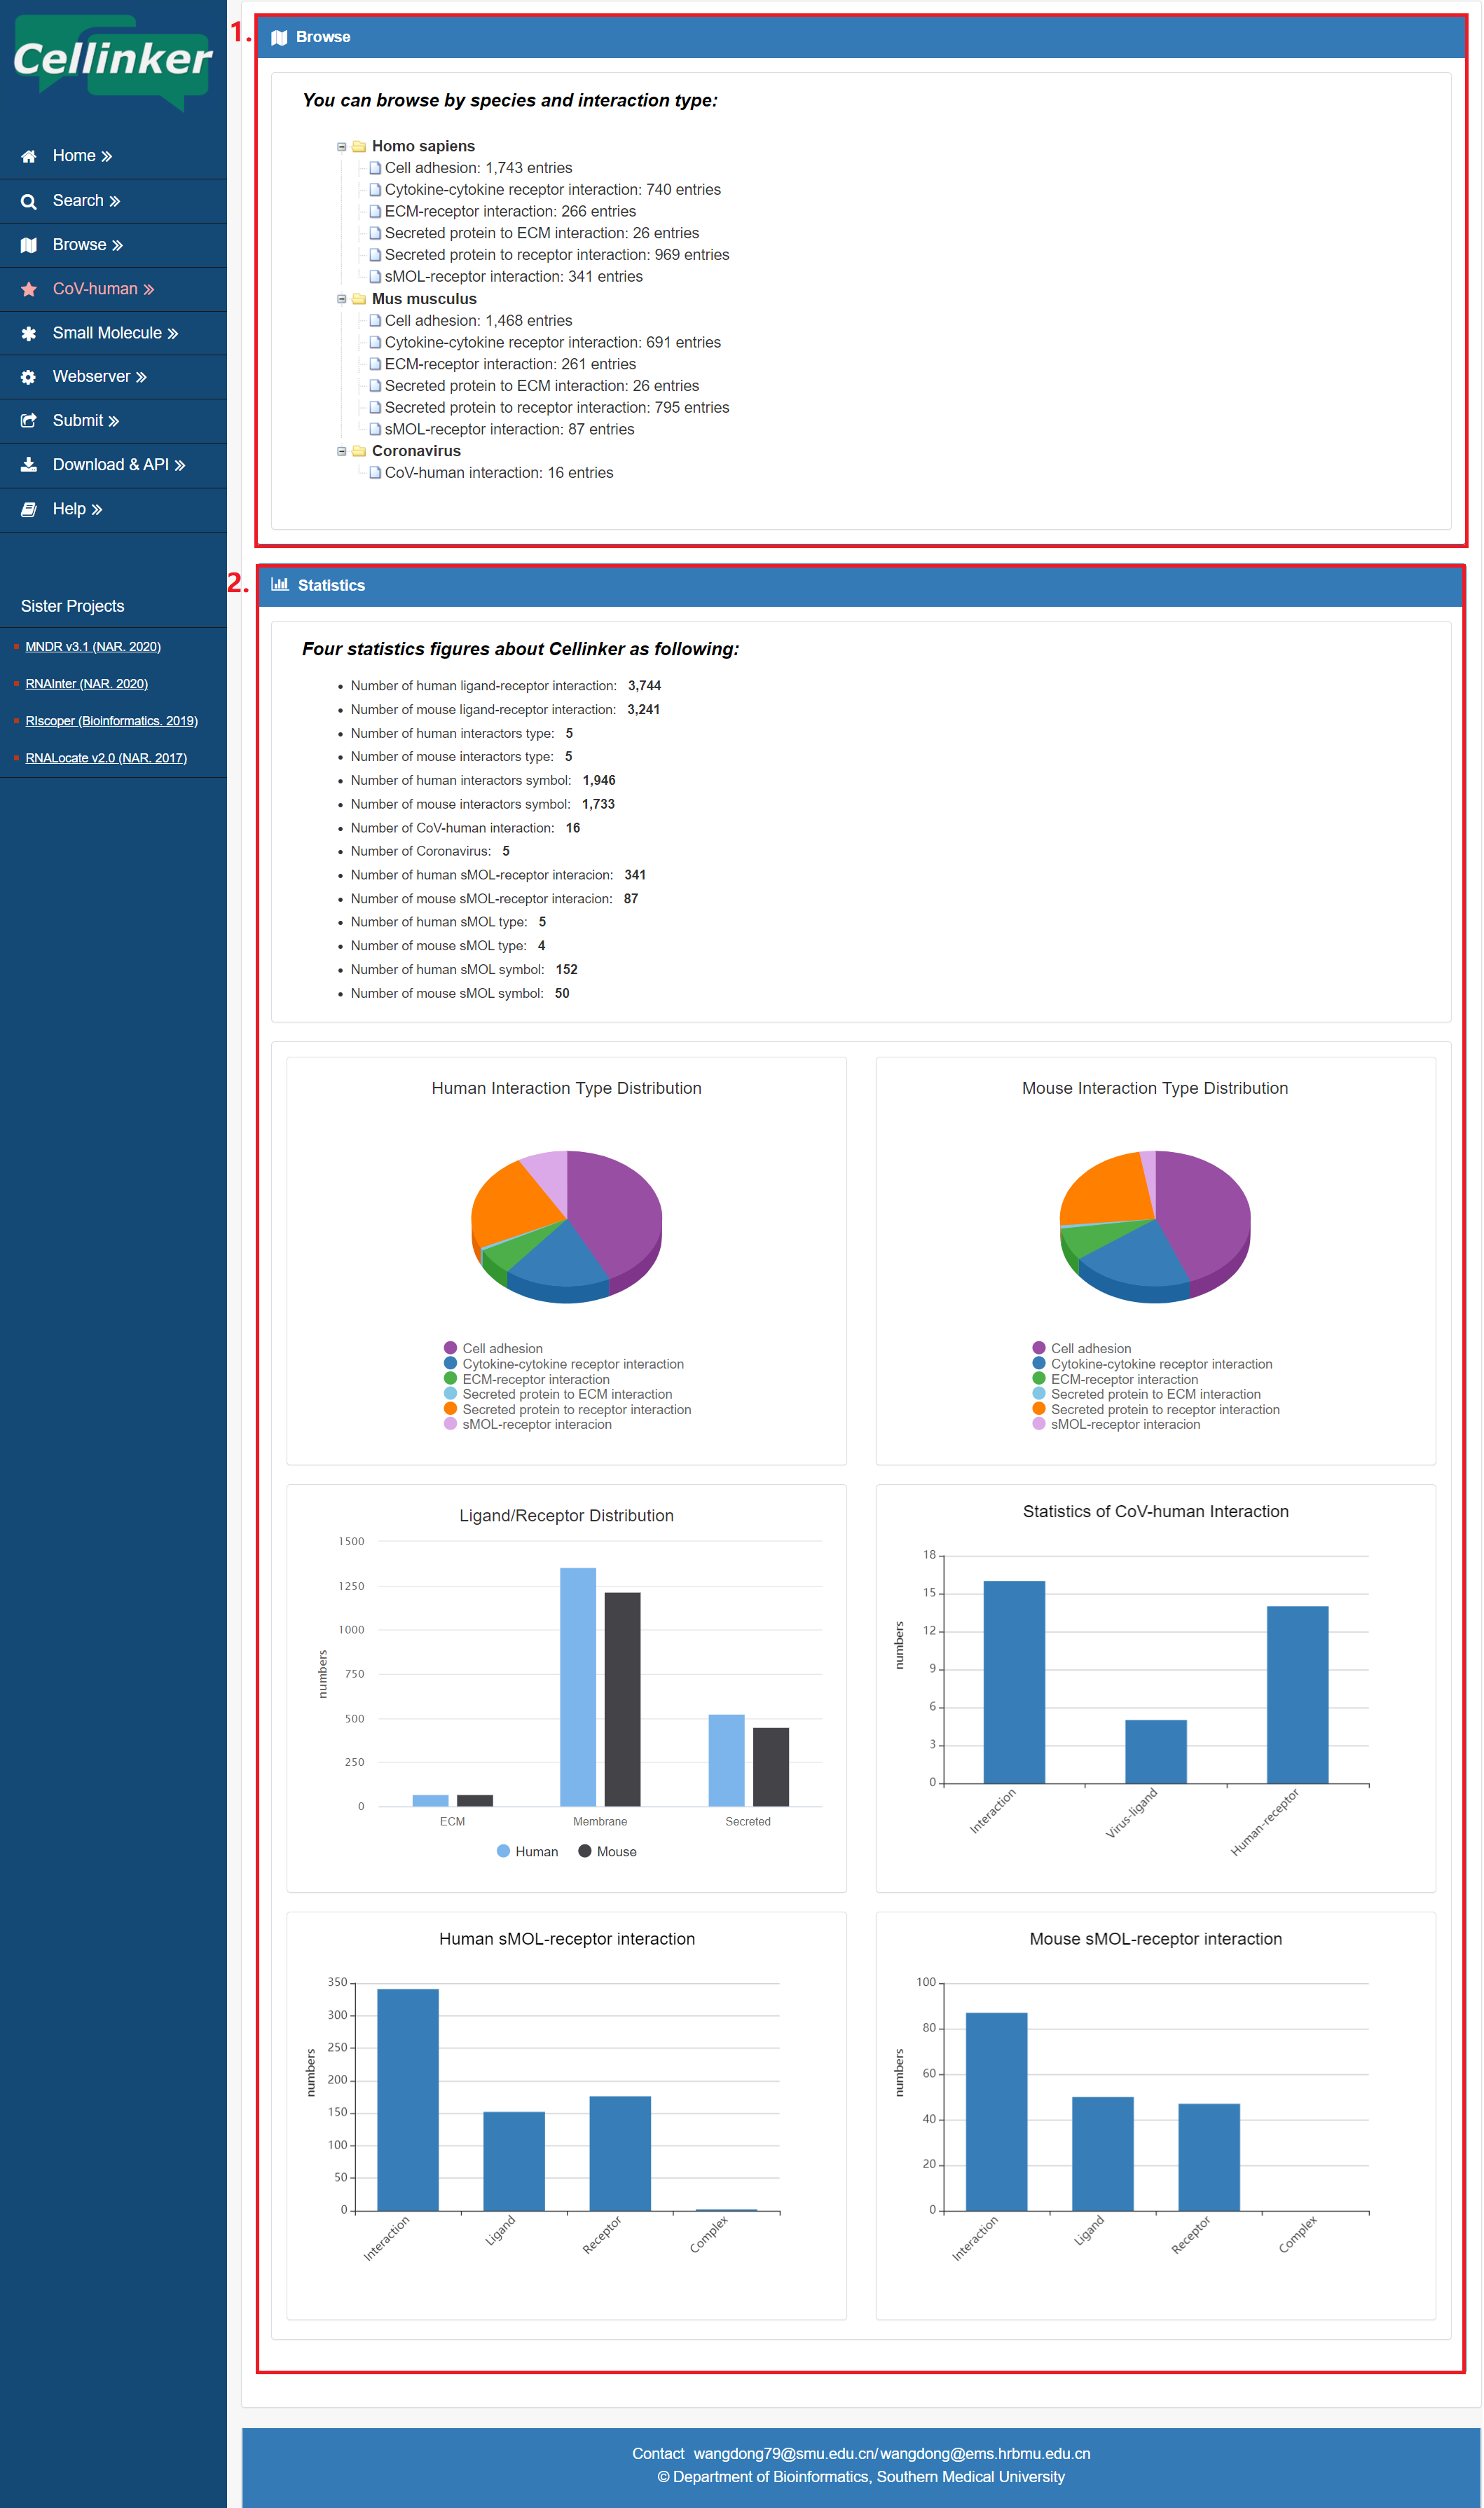
Figure 5-1 browse page
For the convenience of users, Cellinker launched a web server for intercellular communication analysis.
Fig 6-1:
1. Select species of scRNA-seq data.
2. Upload the meta file of your own scRNA-seq data (max 20 MB), zip file is recommended.
3. Upload the counts file of your own scRNA-seq data (max 20 MB), zip file is recommended.
4. The minimum ratio of expressed ligand/receptor in a cell type.
5. The threshold of the P-value (permutation test).
6. Number of statistical iterations of the permutation test (max 1000).
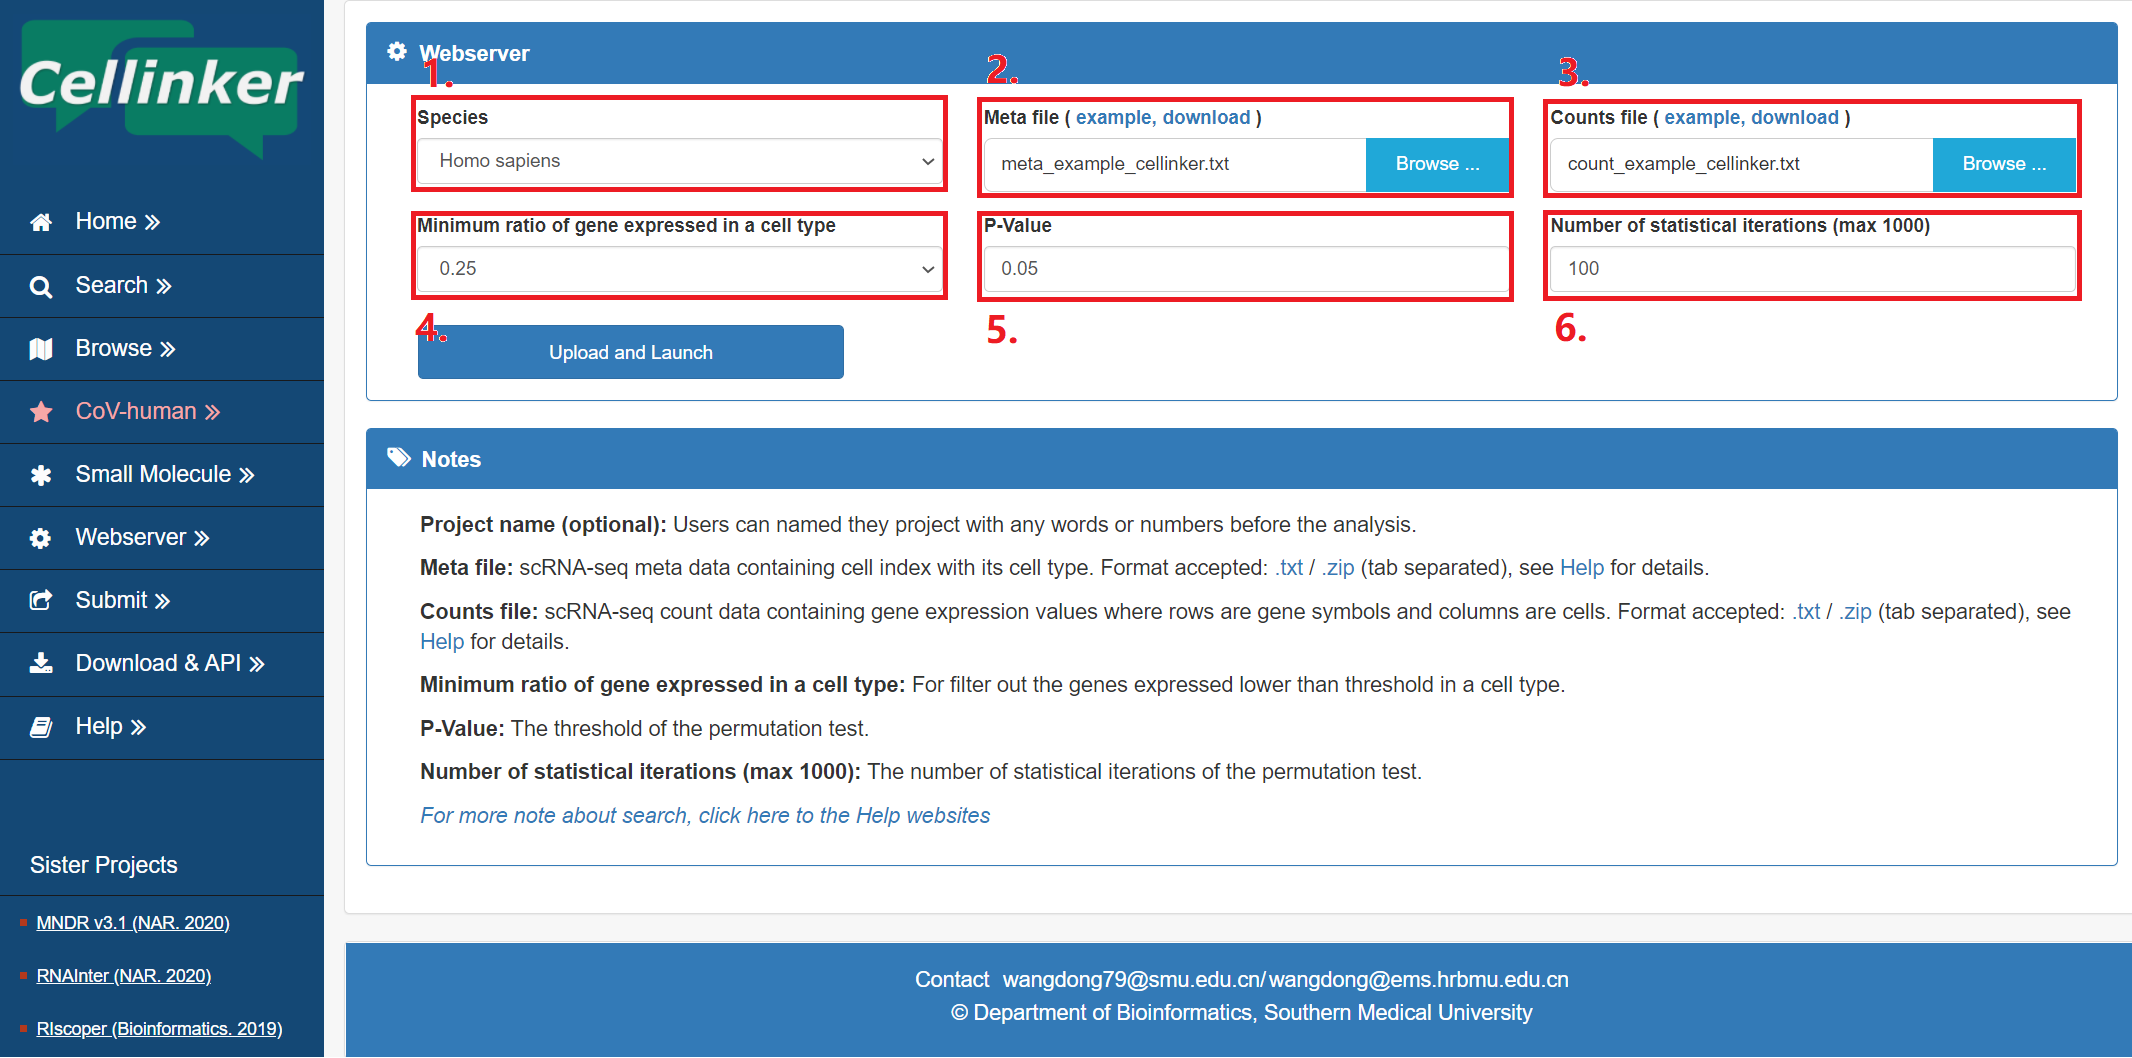
Figure 6-1. webserver page
The format of the meta file is as follow table:
1. The first column: cell IDs.
2. The second column: cell types.
| X397_Dendritic.cells | Dendritic.cells |
| X261_NK.cells | NK.cells |
| X607_T.cells | T.cells |
The format of the counts file is as follow table:
1. The first column: gene symbols.
2. The first row: cell IDs.
3. Other place: the expression values (counts or TPM) for a gene in a cell.
| X261_NK.cells | X607_T.cells | X501_T.cells | X383_Dendritic.cells | |
| TNFRSF18 | 0 | 3.204732 | 0 | 0 |
| TNFRSF4 | 7.881338 | 0 | 0 | 0 |
The result page provides an embedded bubble chart web tool to display the results. (see figure 6-2).
1. Download the score file.
2. Download the P-value file.
3. Download the bubble chart.
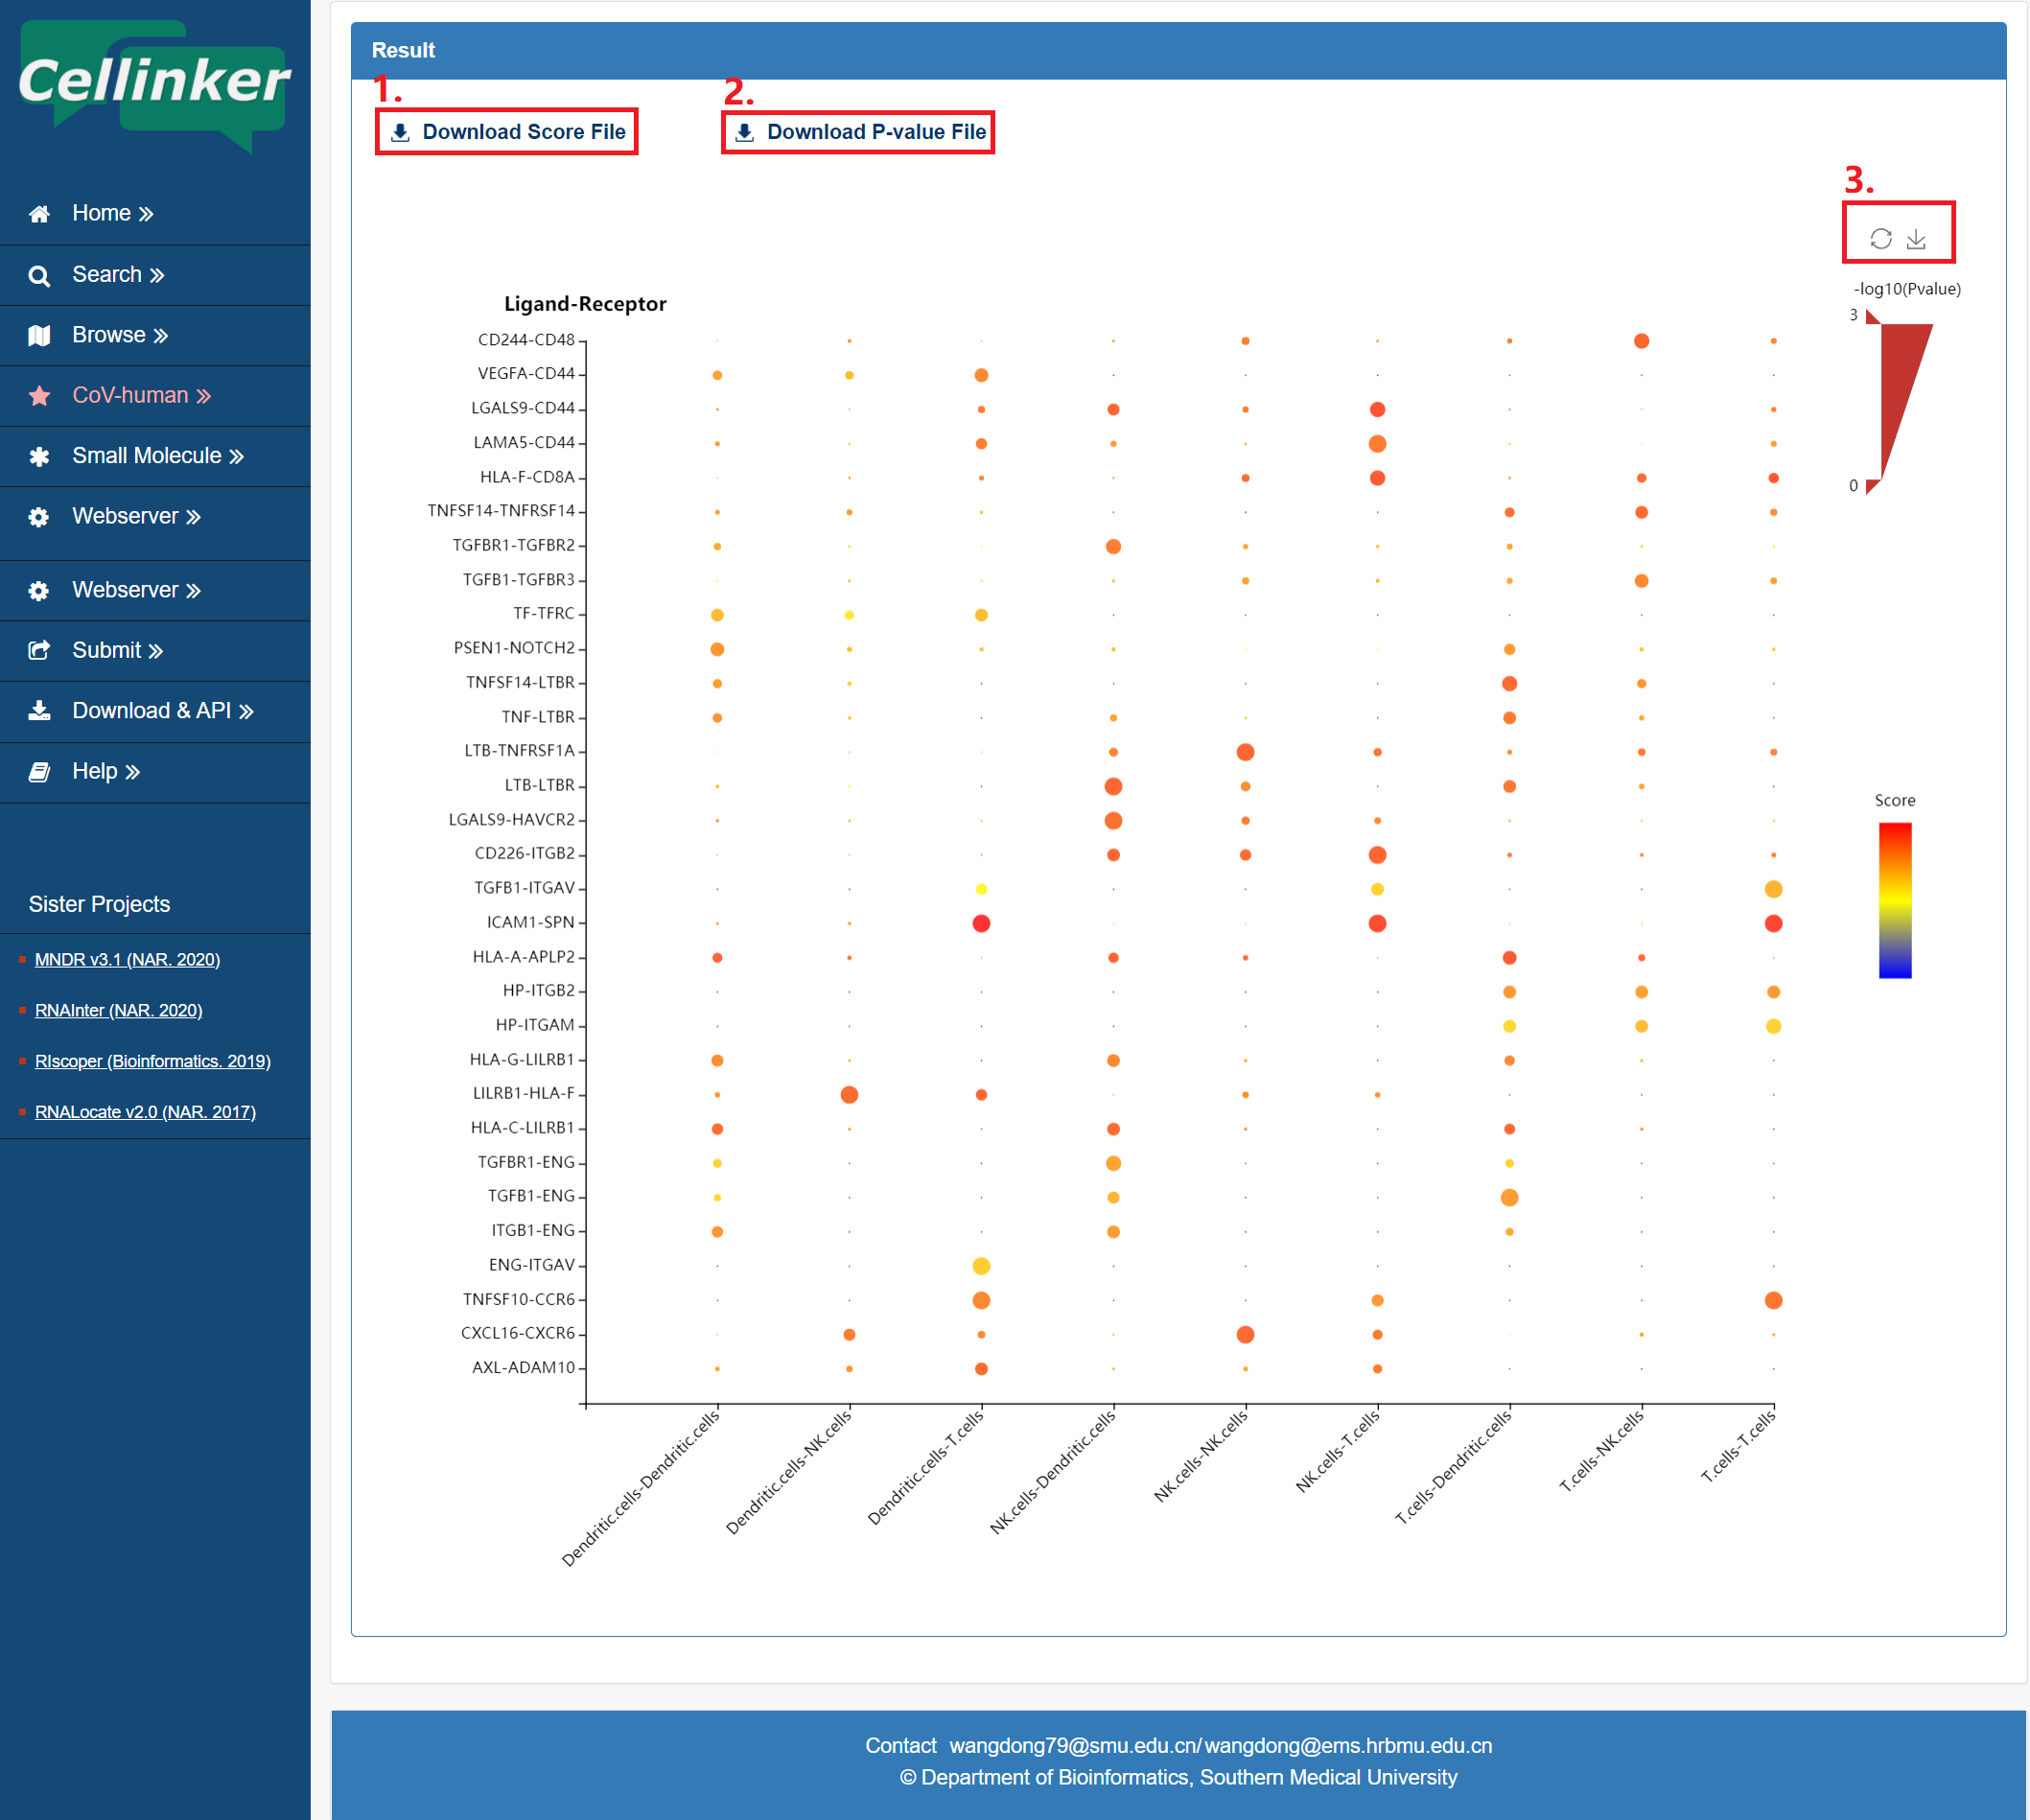
Figure 6-2. the results page of the webserver
Notes:
The results of the analysis contain two measures, score and P-value (default: P < 0.05).