Tutorial
The new development of ViRBase v2.0
1. Expand data sources and the coverage of species. In updated ViRBase v2.0, an over 70-fold increase of virus-host ncRNA-associated interactions by reviewing over 100000 literature and integrating 2 virus-host miRNA-associated experimentally validated databases (VIRmiRNA and VmiReg) and 4 computational prediction databases (HumanVice, RepTar, VmiReg and Zikv-CDB) ,contains up to 91 virus and 28 host organisms.
2. Add and modify the display of predicted binding sites. For RNA–RNA interactions, the binding sites and scores are predicted according to miRanda and RISearch. For RNA–protein interactions, PRIdictor is used to predict RNA-binding residues in proteins. Additionally, ViRBase v2.0 have represented the experimental verified RNA-binding sites in proteins documented in RBPDB, RsiteDB and PDB databases.
3. Assessing the credibility of relationship. An integrative score (S) combining scores from all experimental evidence and predicted evidence sources can show an overall estimation of the reliability of the relationship.
The homepage is displayed in the following Fig 1-1.
Fig 1-1:
1. Main functions of the database are provided in menu bar form (boxed in light blue).
2. A link to our old version ViRBase 1.0.
3. Other databases contributed by our group.
4. Cite information.
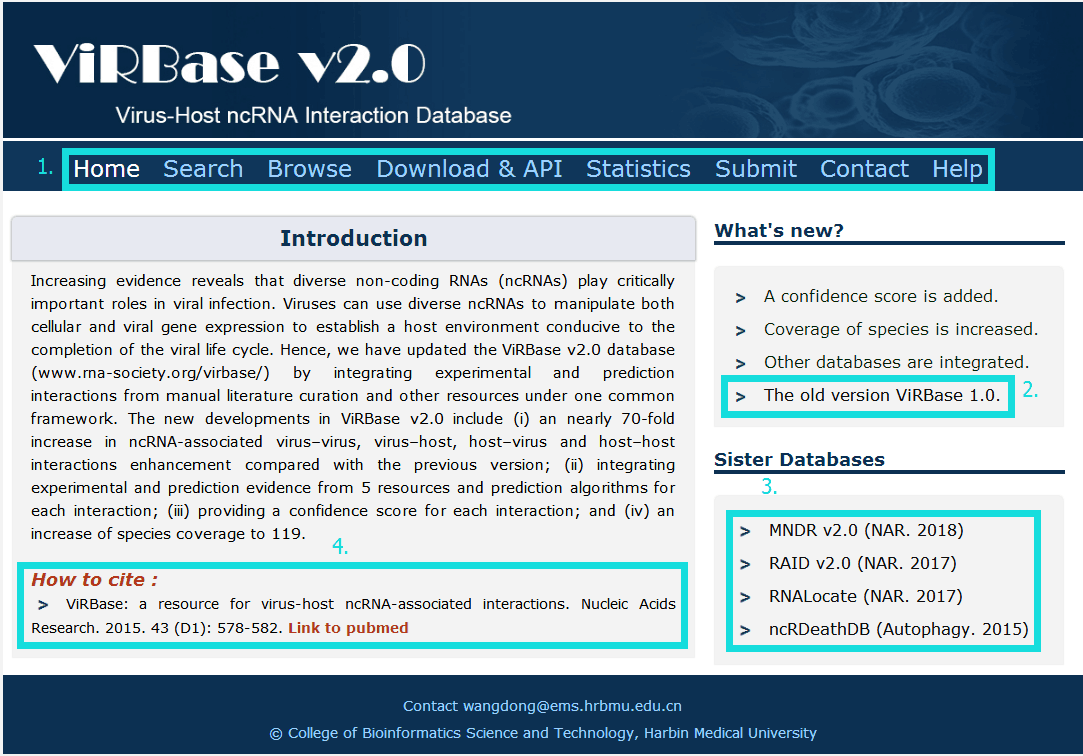
Fig 1-1 Home page
The search page is displayed in Fig 2-1:
1. Carefully select a dataset: Four choices are provided.
2. Enter a keyword corresponding to selected dataset.
3. Both "Fuzzy query" and "Exact query" are supported.
4. Four types provided to filter results: Virus-Virus interaction, Virus-Host interaction, Host-Virus interaction and Host-Host interaction.
5. Use NCBI Gene/NCBI Taxonomy/miRBase to normalize your input symbol.

Fig 2-1 Search page
In the result page, all entries are listed with basic information including RNA/protein symbols, molecular categories, species and score.
Fig 3-1:
1. Your current input conditions.
2. Total sum of results.
3. Click to turn the page.
4. Click to link to detail page.
5. All entries in ViRBase collected from literature by our manually reading.
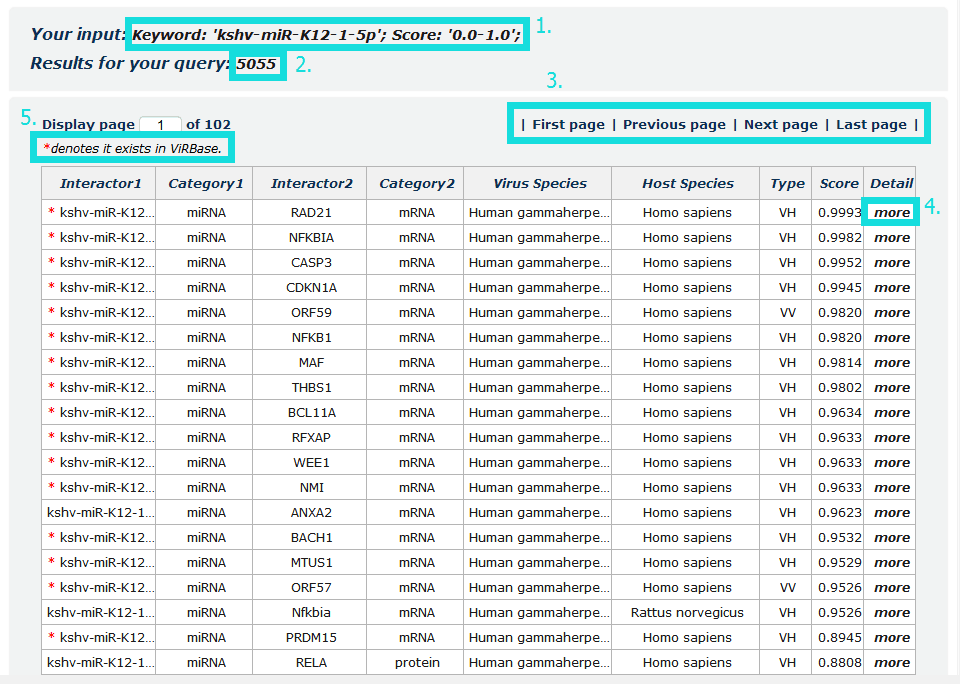
Fig 3-1 Result page
In the detail page, you can get basic information including ViRBase ID, Confidence Score, Interaction Type, Predicted Binding sites, Interactor Information, Evidence Support and References.
Fig 4-1:
For ncRNA-RNA interaction, users can choose any union of two transcript accessions and click to see results displayed either by miRanda or RIsearch.
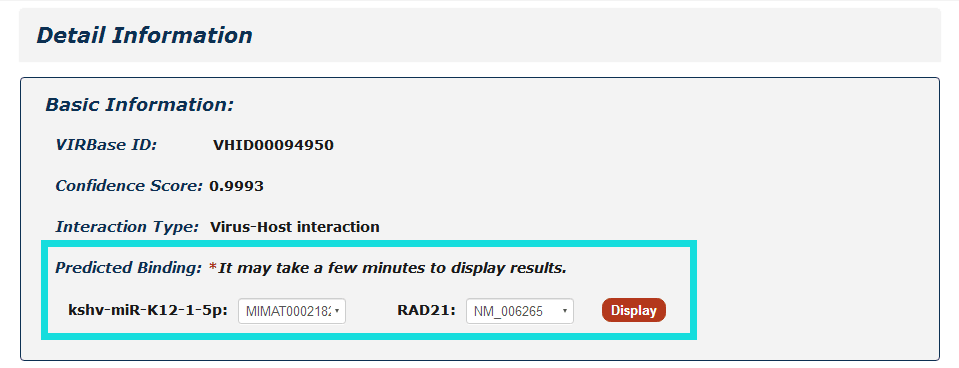
Fig 4-1 Detail page of ncRNA-RNA interaction.
Fig 4-2:
1. For ncRNA-Protein interactions, users can choose any protein accessions and click to see results displayed by PRIdictor.
2. Users can also get RNA-binding sites in proteins documented in RBPDB, RsiteDB and PDB, and click each PDB id to link to PDB database.
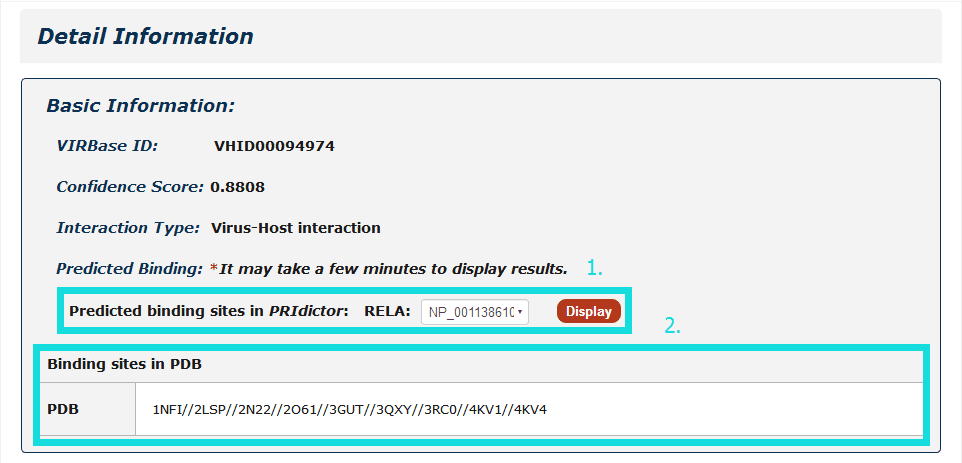
Fig 4-2 Detail page of ncRNA-protein interaction.
Fig 4-3:
1. Click any interactor as a keyword to search in database.
2. Click Entrez ID/miRBase Accession to see its basic description in NCBI Gene/miRBase database.

Fig 4-3 Detail page of basic information.
Fig 4-4:
1. Evidence Support including four parts: strong evidence, weak evidence, prediction evidence and support database(divided into verified and prediction database).
2. The region of interactor2 targeted by interactor1.
3. The source of database, tissue or cell line, and expression of each interactor.
4. Click pubmed ID to see description in detail.
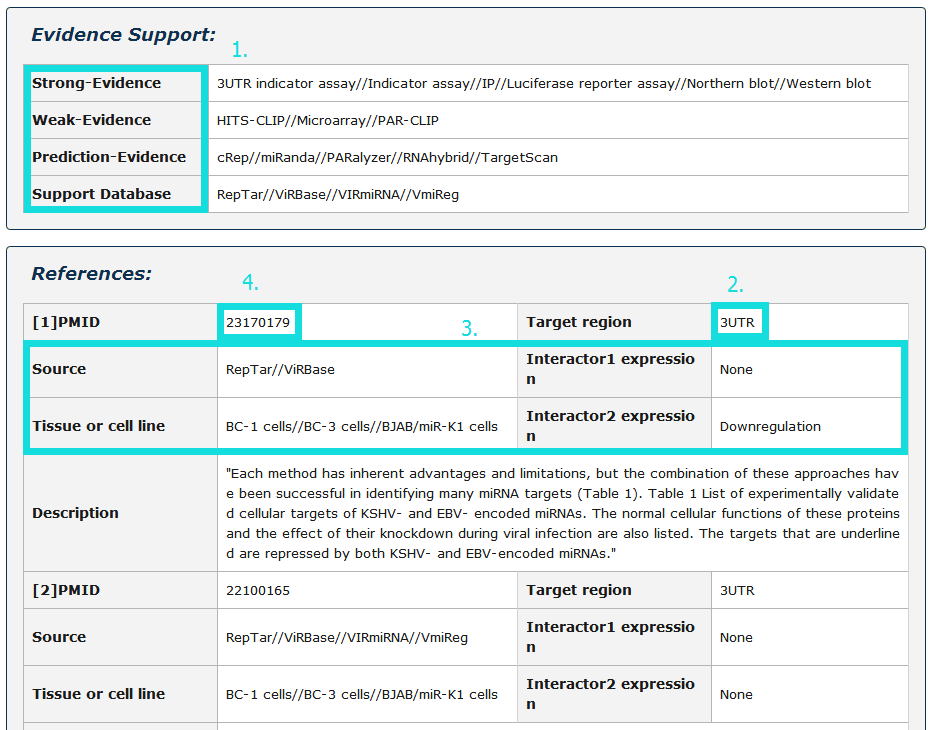
Fig 4-4 Detail page of evidence support and references.
In the browse page, you can click each node to see results.
1. 'Interaction Type' display all entries as long as the current type of interactors involved.
2. 'Detection methods' display all entries as long as the current selected method is involved.
3. 'Species' display all entries as long as one molecule's organism matches the condition.
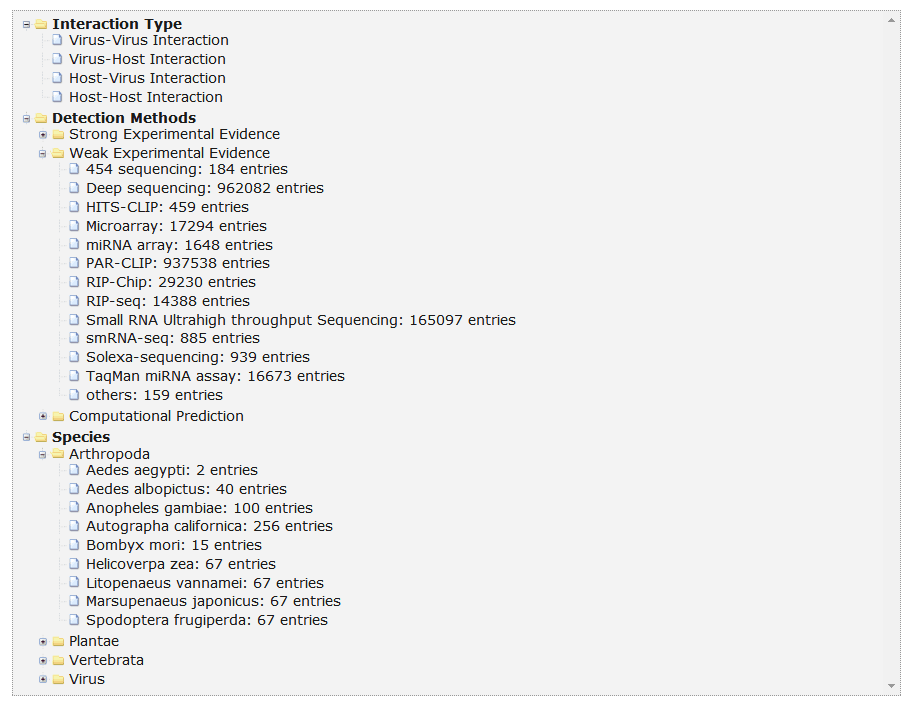
Fig 5-1 Browse page
In ViRBase v2.0, the ncRNA-associated interactions are collected from different types of resources under one common framework, including experimental and computational prediction evidence. In principle, we assume that:
1. Experimental evidence should contributes more significantly to the confidence score than does evidence derived from computational prediction algorithms;
2. Strong experimental evidence with lower false positive rates are considered to provide more reliable evidence than weak experimental evidence;
3. ncRNA-associated interactions supported by more evidence resources should be given higher confidence scores than those supported by fewer evidence resources.
Similar to RNAInter database, according to the evidence types and number of evidence resources, we calculate the confidence score (S) for each ncRNA-associated interaction as follows:

where i is the evidence type(ss: strong experimental evidence, sw: weak experimental evidence, sp: computational prediction method), x is the number of evidence resources, we set weight factor Ws, Ww and Wp to 1, 0.7, and 0.2, respectively(if x=0, we set weight factor Wi to 0).
Integration of source databases which use different ncRNA and disease naming conventions is challenging. To ensure maximal connectivity of data, we transform each ncRNA and protein name found in the input sources to the appropriate naming convention.
1. For miRNA, we use miRBase ID and miRBase Accession.
2. For others, we use official Gene Symbol and Entrez ID.
3. For species, we normalized organism names according to NCBI Taxonomy Database.
4. For Virus Family, we normalized according to ICTV Database.