The homepage is displayed in the following Fig 1-1 and Fig 1-2.
Fig 1-1:
1. Main functions of the database are provided in menu bar form (boxed in blue).
2. A link to our old version RAID 1.0.
3. Other databases contributed by our group.
4. A quick view of functions in RAID.
5. Cite information.
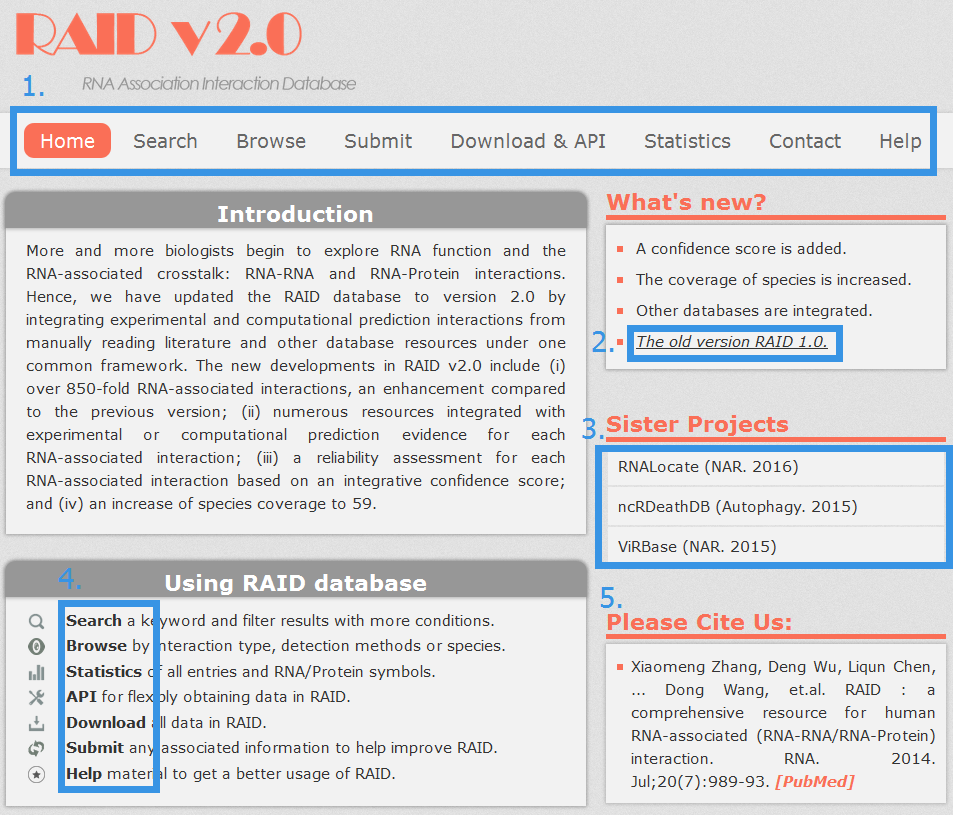
Fig 1-1 Homepage
Fig 1-2:
1. Update news about RAID.
2. Resources integrated in RAID.
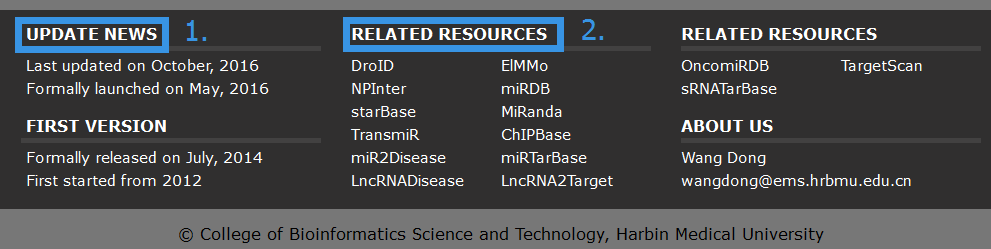
Fig 1-2 Homepage
The search page is displayed in Fig 2-1:
1. Carefully select a dataset: Three choices are provided.
2. Enter a keyword corresponding to selected dataset.
3. Select if you want to exactly search the keyword, or we will search the keyword in a fuzzy pattern.
4. Four categories provided to filter results: Interaction Type, Species, Detection Method and Score.
5. Use NCBI Gene or miRBase to normalize your input symbol.
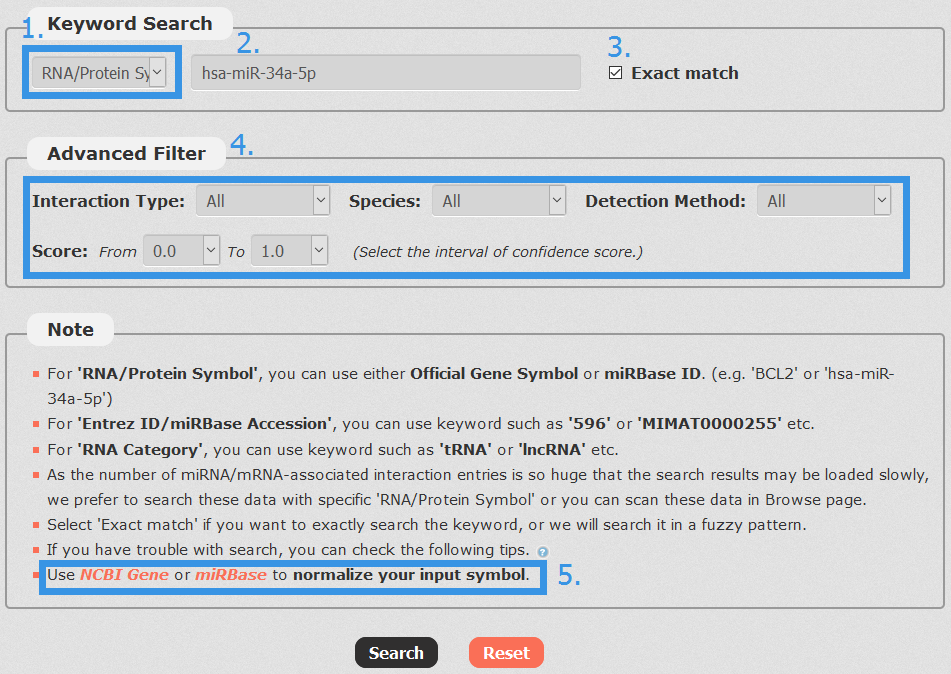
Fig 2-1 Search page
In the result page, all entries are listed with basic information including RNA/Protein symbols, molecular categories, species and score.
Fig 3-1:
1. Your current input conditions.
2. Total sum of results.
3. Click to turn the page.
4. Click any interactor as a keyword to search in RAID database.
5. Click to link to detail page.
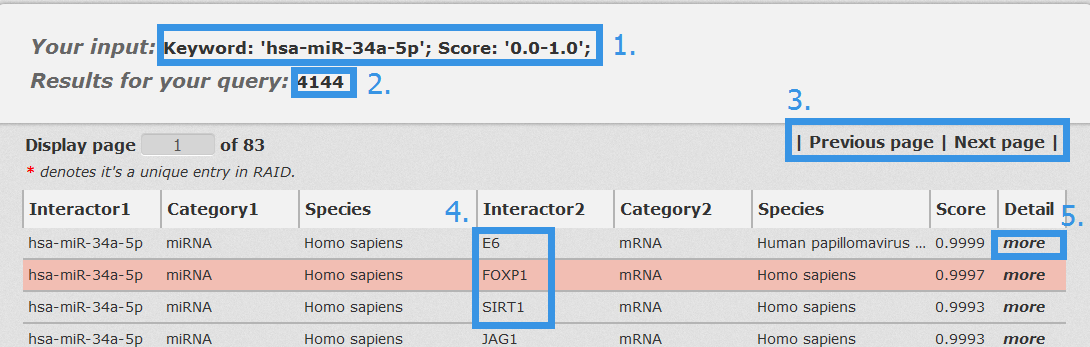
Fig 3-1 Result page
In the detail page, you can get information including RAID ID, confidence score, interaction type, predicted binding sites, basic information, evidence support and references.
Fig 4-1:
For RNA-RNA interactions, users can choose any union of two transcript accessions and click to see results displayed either by miRanda or RIserch.
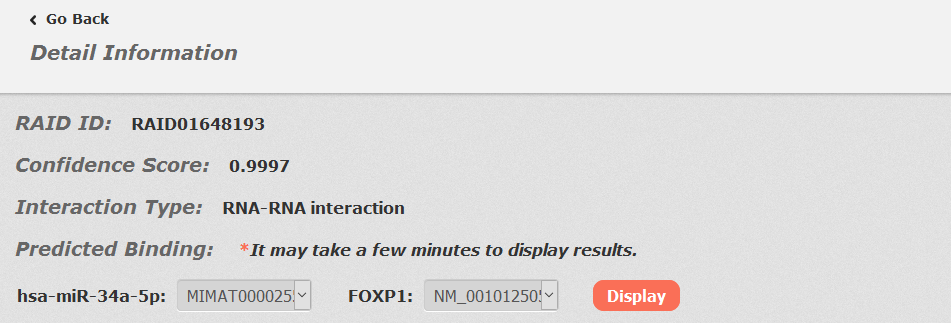
Fig 4-1 Detail page of RNA-RNA interaction.
Fig 4-2:
1. For RNA-Protein interactions, users can choose any transcript accessions and click to see results displayed by PRIdictor.
2. Users can also get RNA-binding sites in proteins documented in RBPDB, RsiteDB and PDB.
3. Users can click each PDB id to link to PDB database.
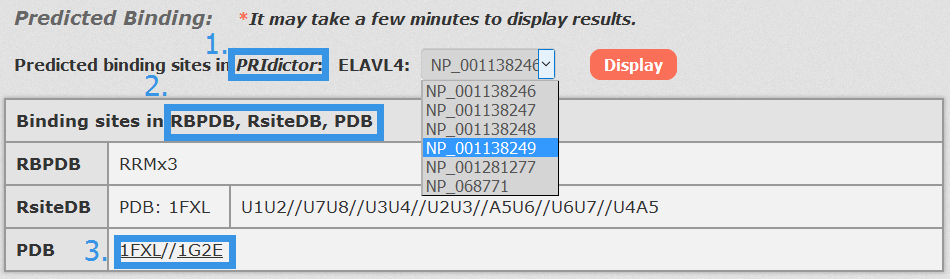
Fig 4-2 Detail page of RNA-Protein interaction.
Fig 4-3:
1. Click any interactor as a keyword to search in database.
2. Click Entrez ID/miRBase Accession to see its basic description in NCBI Gene/miRBase database.
3. Click to see results in Uniprot.
4. Alias, other ids and description of each RNA/Protein symbol.
5. Click "more" to see all homology information.
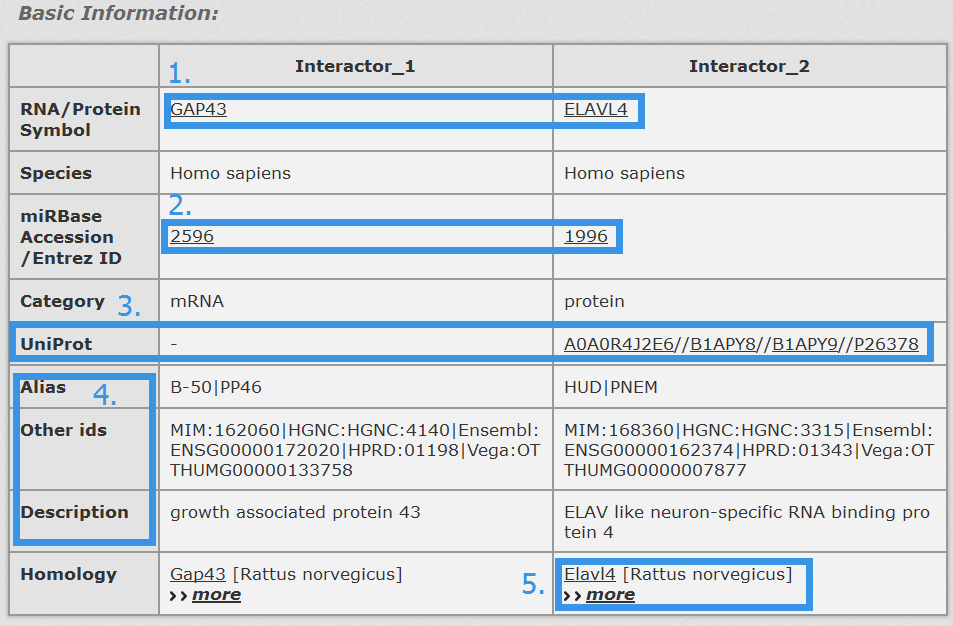
Fig 4-3 Detail page of basic information.
Fig 4-4:
1. Evidence Support including three parts: strong evidence, weak evidence and support database (divided into verified and prediction database).
2. Click Entrez ID/miRBase Accession to see its basic description in NCBI Gene/miRBase database.
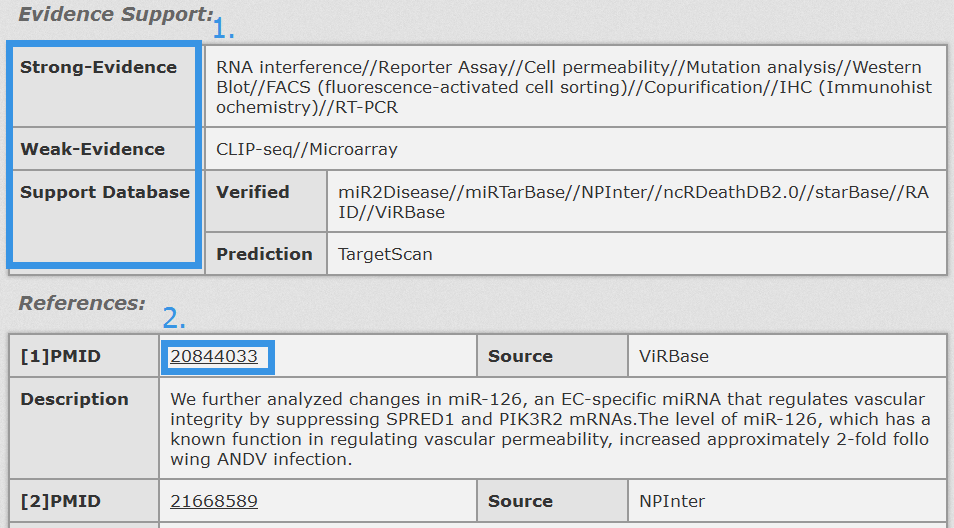
Fig 4-4 Detail page of evidence support
In the browse page, you can click each node to see results.
1. 'Interaction type' indicates the category of both interactors.
2. 'Detection methods' display all entries as long as the current selected method is involved.
3. 'Species' display all entries as long as one molecule's organism matches the condition.
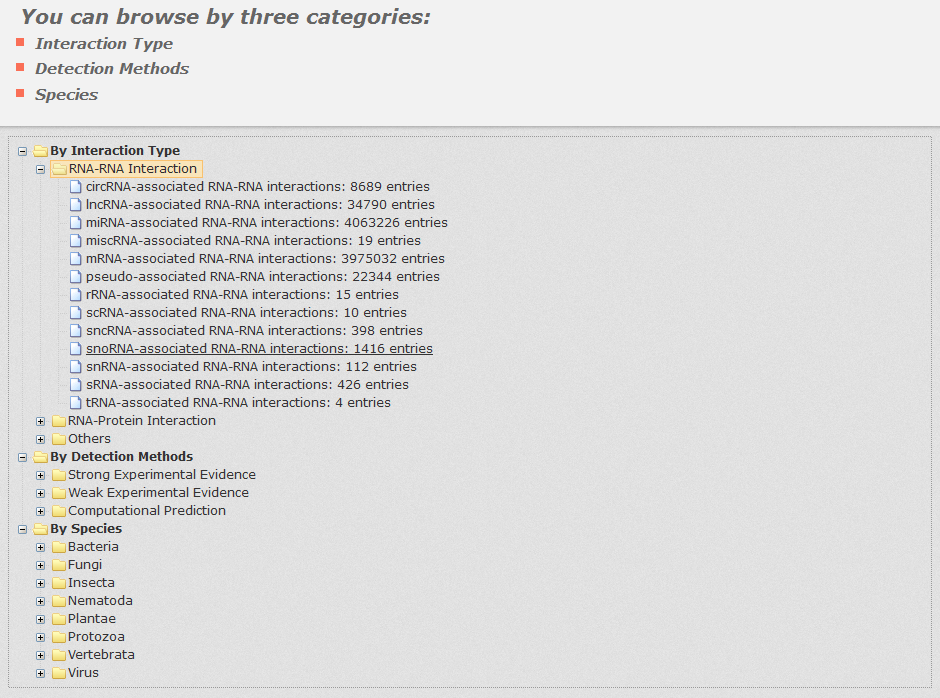
Fig 5-1 Browse page
- In RAID v2.0, the RNA-associated interactions are collected from different types of resources under one common framework, including experimental and computational prediction evidence. In principle, we assume that (i) experimental evidence contributes more significantly to the confidence score than does evidence derived from computational prediction algorithms; (ii) strong experimental evidence with lower false positive rates are considered to provide more reliable evidence than weak experimental evidence; and (iii) RNA-associated interactions supported by more evidence resources should be given higher confidence scores than those supported by fewer evidence resources. Therefore, we firstly assign quantitative confidence scores (strong experimental evidence: ss, weak experimental evidence: sw, computational prediction database: sp) to each RNA-associated interaction based on the evidence types and number of evidence resources as follows:
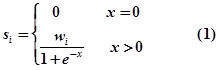
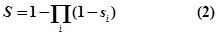
- where i is the evidence type (ss: strong experimental evidence, sw: weak experimental evidence, sp: computational prediction database) and x is the number of evidence resources, we set weight factor ws, ww and wp to 1, 0.75 and 0.25, respectively.Finally, an integrative confidence score (S) is calculated as:
Integration of source databases which use different RNA naming conventions is challenging. To ensure maximal connectivity of data, we transform each gene name found in the input sources to the appropriate naming convention.
1. For miRNA, we use miRBase ID and miRBase Accession.
2. For others, we use official Gene Symbol and Entrez ID.
3. For species, we normalized organism names according to NCBI Taxonomy Database.